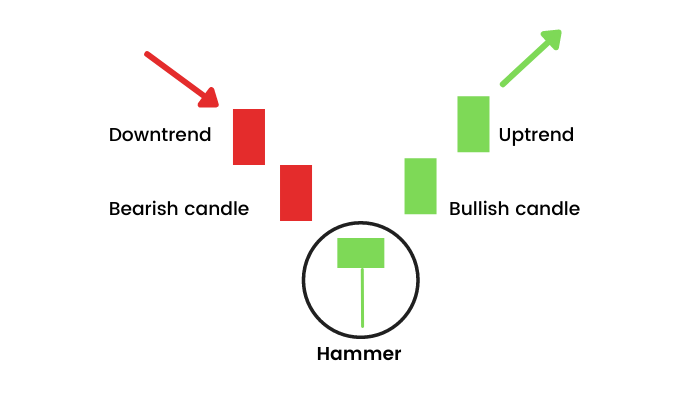
The Hammer is a single candlestick reversal pattern that suggests a potential change in direction of the market, specifically a reversal from a downtrend to an uptrend. It gets its name because its shape resembles a hammer, with a long lower shadow (wick) and a small body at the top of the candlestick. The Hammer can appear at the bottom of a downtrend, and when confirmed, it indicates that buying pressure has begun to outweigh selling pressure.
1. Characteristics of the Hammer Candlestick Pattern:
The key features of the Hammer candlestick are:
- Small Body: The body of the Hammer is small, and it forms near the top of the candle, either at the open or close of the session. It can be either bullish (green/white) or bearish (red/black), although a bullish Hammer is typically considered a stronger signal when it follows a downtrend.
- Long Lower Shadow: The lower shadow (or wick) should be at least twice the length of the body. This long shadow indicates that sellers pushed the price lower during the session, but buyers stepped in and pushed the price back up, closing near the opening price.
- Little or No Upper Shadow: Ideally, the upper shadow should be very small or nonexistent. A small upper shadow means that the price didn’t rise significantly during the session, and the action was concentrated near the low of the trading period.
Hammer Criteria:
- Small real body: The difference between the opening and closing prices is small.
- Long lower shadow: The lower shadow should be at least twice the length of the body (some traders use a ratio of 2:1 or 3:1).
- Little to no upper shadow: A small or non-existent upper wick is ideal.
- Location: The Hammer should appear after a downtrend, signaling a potential reversal.
2. How to Identify a Hammer Pattern:
To spot a Hammer pattern on a price chart, you need to look for the following:
- Trend Preceding the Hammer: The Hammer pattern must appear after a downtrend. This suggests that sellers have been in control, and the long lower shadow reflects an attempt by the bears to push the price lower before buyers intervene.
- Candle Body: The candle has a small body near the top of the range, which indicates that there was some indecision during the session but that the bulls were able to regain control by the close.
- Lower Shadow: The lower shadow should be at least twice the length of the body. This long shadow indicates that the price fell significantly during the session, but buyers were able to drive it back up to close near or at the opening price.
- Upper Shadow: The upper shadow is either nonexistent or very small. If there is a long upper shadow, it suggests that the bulls were unable to maintain control, and the pattern would be considered a hanging man, which has a bearish implication (see below).
3. Types of Hammer Candlestick Patterns:
- Bullish Hammer: The most common form of the Hammer is bullish, where the price closes at or near the open after a downtrend. This is considered a strong signal of a potential reversal.
- A green/white candle with a small body and a long lower shadow typically indicates that the sellers were in control at some point during the session but the buyers ultimately pushed the price higher, signaling a shift in market sentiment.
- Inverted Hammer: The Inverted Hammer has a small body near the bottom of the price range with a long upper shadow, and it appears at the bottom of a downtrend.
- Despite its name, it’s still a bullish reversal pattern, though the confirmation requirements are slightly different. It suggests that buyers initially attempted to push prices higher during the session, but the bears regained control and drove the price back down.
- The Inverted Hammer needs confirmation, typically in the form of a subsequent bullish candlestick.
- Hanging Man: A Hanging Man is structurally the same as the Hammer but appears after an uptrend. It has the same characteristics (small body, long lower shadow), but the market context is different. The Hanging Man is typically a bearish reversal pattern, signaling that, after an uptrend, the bears may be gaining control and a potential downtrend could follow.
- The key distinction between the Hammer and the Hanging Man is the trend leading up to the pattern. The Hanging Man appears after an uptrend, while the Hammer appears after a downtrend.
4. Interpretation of the Hammer Pattern:
The Hammer is interpreted as a reversal signal, indicating that the prevailing downtrend may be coming to an end, and the price could reverse upward. Here’s how the pattern works:
- Sellers push the price down during the session, creating a long lower shadow. This shows that there is strong selling pressure.
- Buyers step in toward the end of the session, pushing the price back up to close near the opening price (or at it). This suggests that the bears were not able to maintain control, and there is now buying interest at lower prices.
- The small body shows indecision or balance, but the long lower shadow suggests that the sellers attempted to push the price lower but were overwhelmed by the buyers.
The Hammer is a signal that market sentiment may be shifting from bearish to bullish, but confirmation is necessary before acting on the pattern.
5. How to Trade the Hammer Pattern:
- Entry: A trader may enter a buy position after the formation of the Hammer, preferably when the price breaks above the high of the Hammer (i.e., the high of the Hammer candle). This confirms that the buyers have taken control and the price is likely to move higher.
- Stop-Loss: To manage risk, a stop-loss should typically be placed just below the low of the Hammer candle. If the price falls below this level, it suggests that the reversal has failed, and the trend may continue downward.
- Profit Target: Profit targets can be set at key resistance levels, prior highs, or based on a risk-to-reward ratio (e.g., 2:1 or 3:1). You can also use technical indicators, like moving averages or Fibonacci levels, to determine potential areas of resistance.
6. Confirmation and Risk Management:
While the Hammer is a potential reversal signal, confirmation is important to increase the probability of a successful trade:
- Confirmation Candle: The most common confirmation for a Hammer pattern is the formation of a strong bullish candlestick (green/white) in the next session, closing above the high of the Hammer candle. This indicates that the market is indeed reversing, and buying pressure is increasing.
- Volume: Higher trading volume on the third candle (the bullish confirmation candle) adds strength to the reversal signal, confirming that there is genuine buying interest.
- Indicator Confirmation: Use additional indicators such as RSI, MACD, or moving averages to confirm the trend reversal. For example, if the RSI is oversold and begins to move higher, it adds confirmation to the bullish reversal signal.
7. Limitations of the Hammer Pattern:
- False Signals: The Hammer can give false signals, especially in volatile or sideways markets. The long lower shadow might be created by market noise, and without confirmation, the reversal might not happen.
- Context Matters: The Hammer’s effectiveness is greatly improved when it forms after a prolonged downtrend. If the Hammer forms in an uptrend or during a consolidation phase, it might not be as reliable.
- Need for Confirmation: Since the Hammer is a reversal pattern, it should be confirmed by subsequent price action, usually a strong bullish candle, to validate the potential trend reversal. Without confirmation, the pattern might be a false signal.
8. Example of Hammer Candlestick in Action:
Let’s say the price of a stock has been trending down for several weeks. You observe the following:
- Candle 1: A long red (bearish) candle that closes near the low of the session.
- Candle 2 (Hammer): A small-bodied candle with a long lower shadow, closing near the top of the candle. The price action shows that sellers initially pushed the price down, but buyers stepped in and pushed the price back up.
After this Hammer candle, if a subsequent bullish candle confirms the reversal (with a close above the high of the Hammer), you could enter a long position, placing your stop-loss below the low of the Hammer candle.
9. Key Takeaways:
- The Hammer is a bullish reversal pattern that appears at the bottom of a downtrend.
- It consists of a small body with a long lower shadow, signaling that sellers tried to push the price down but buyers took control by the close.
- The Hanging Man is the opposite of the Hammer and appears after an uptrend, signaling a potential bearish reversal.
- Confirmation is crucial: The Hammer should be confirmed by a strong bullish candle and ideally, higher volume, to ensure the trend is indeed reversing.
- Use proper risk management, such as placing stop-loss orders just below the low of the Hammer candle and setting profit targets based on resistance levels or a defined risk-to-reward ratio.
By understanding the Hammer candlestick pattern and its context, traders can take advantage of potential trend reversals, but it is important to use it in conjunction with other technical analysis tools and strategies for higher reliability.