A Bullish Marubozu is a strong bullish candlestick pattern that signals a decisive upward movement in the market. It is a single candlestick pattern characterized by a long body with no or very small wicks (shadows) at both the top and bottom of the candle. The lack of significant shadows indicates that the price moved steadily upward throughout the entire trading session, with the bulls maintaining control from the open to the close.
1. Characteristics of a Bullish Marubozu:
The Bullish Marubozu candlestick has the following key characteristics:
- Long Bullish Body:
- The body of the candlestick is long and typically filled with a solid color (green or white), indicating that the closing price is at or near the high of the session.
- No Upper Shadow (or very small):
- The upper shadow (wick) is either absent or extremely small. This suggests that the price reached its high and stayed there, showing that buying pressure was strong and there was no significant resistance during the session.
- No Lower Shadow (or very small):
- The lower shadow (wick) is also either absent or very small, indicating that there was little to no selling pressure during the session and that the price did not drop significantly after the open.
- Strong Closing Price:
- The candle closes at or near the highest price of the session, further reinforcing the idea that buyers controlled the market during the entire period.
2. How to Identify a Bullish Marubozu:
To identify a Bullish Marubozu, look for the following:
- Single Candle:
- The pattern is a single candlestick that forms after a downtrend or consolidation, indicating a strong reversal or continuation in an uptrend.
- Open and Close Price:
- The open price should be at or near the low of the candle, and the close price should be at or near the high of the candle.
- Minimal Shadows:
- The candlestick should have little to no upper or lower shadows. If there are shadows, they should be very small, and they should not exceed 10% of the body length.
- Strong Close:
- The close must be near the high of the session, demonstrating that the bulls were in control throughout the trading period.
3. Interpretation of the Bullish Marubozu:
The Bullish Marubozu suggests strong buying momentum and is interpreted as a bullish signal. Here’s why:
- Control by Bulls: The absence of shadows and the long body indicate that buyers maintained control throughout the entire session. This means that demand was strong enough to push the price up without any significant resistance from the sellers.
- Decisive Move Upward: The fact that the price opened at the low and closed near the high indicates a strong bullish sentiment. The market was dominated by buying pressure with little to no retracement.
- Trend Continuation or Reversal: If the Bullish Marubozu appears in the middle of a downtrend, it can signal a trend reversal, indicating that the bears are losing control and the bulls are taking over. If it appears during an uptrend, it suggests that the bullish momentum will continue.
4. How to Trade the Bullish Marubozu:
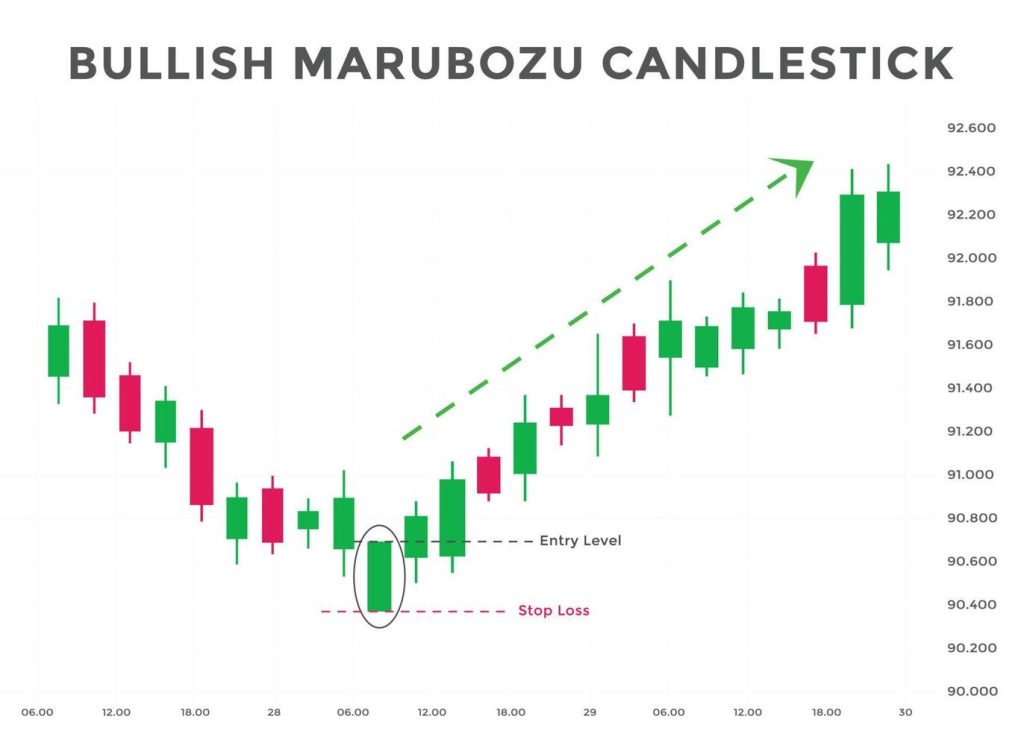
Entry:
- A buy position can be taken once the Bullish Marubozu completes and closes, especially if the price closes near its high and the overall market conditions are favorable for a bullish move.
- Some traders prefer to enter the market once the price moves above the high of the Bullish Marubozu to confirm that the trend is continuing.
Stop-Loss:
- A common stop-loss placement is below the low of the Bullish Marubozu candlestick. If the price retraces and drops below the low of the candlestick, it would indicate that the bullish momentum has failed.
- Another option is to place the stop-loss below the low of the prior candle (if it’s part of a larger pattern or trend), providing a bit more room for fluctuations.
Profit Target:
- Profit targets can be set using resistance levels such as previous highs, trendlines, or Fibonacci retracement levels.
- You could also use a risk-to-reward ratio (e.g., 2:1 or 3:1) to calculate a realistic exit point based on your stop-loss distance.
5. Confirmation and Additional Indicators:
Confirmation is Key:
- While the Bullish Marubozu is a strong candlestick on its own, it’s important to wait for confirmation from the market to reduce the risk of a false signal. Confirmation can come in the form of:
- Follow-up Bullish Candlestick:
- A strong bullish candlestick after the Bullish Marubozu (closing higher than the high of the Marubozu) is a good confirmation that the bullish trend is likely to continue.
- Volume:
- A high volume on the Bullish Marubozu adds strength to the signal. Strong buying volume indicates that the move is backed by substantial market participants, increasing the likelihood of the trend continuing.
- Momentum Indicators:
- RSI (Relative Strength Index): If the RSI is near oversold conditions (below 30) before the Bullish Marubozu forms and begins to rise afterward, it can confirm the upward momentum.
- MACD (Moving Average Convergence Divergence): A bullish crossover in the MACD or positive divergence can strengthen the signal.
- Moving Averages: If the price is breaking above a key moving average (such as the 50-day or 200-day moving average), it can provide additional confirmation of the trend reversal or continuation.
6. Example of the Bullish Marubozu Pattern:
Let’s say the price of a stock has been in a downtrend:
- Candle 1 (Bearish): The stock closes at $100, after opening at $105.
- Candle 2 (Bullish Marubozu): The stock opens at $98, forms a long green candle, and closes at $110. The entire body of the candlestick is green, with no significant shadows.
In this example, after the Bullish Marubozu closes, a trader could consider entering a long position at $110 or higher (the close of the Marubozu candle), with a stop-loss set just below $98 (the low of the candle). The trader may target the next resistance level as their profit target.
7. Limitations of the Bullish Marubozu:
While the Bullish Marubozu is a strong bullish signal, there are some limitations:
- False Signals:
- The Bullish Marubozu can sometimes produce false signals, especially in choppy or volatile markets. If the market shows weak follow-through after the pattern, the trend reversal may not be reliable.
- Requires Confirmation:
- As with any candlestick pattern, it’s essential to wait for confirmation, such as a follow-up bullish candle, an increase in volume, or positive momentum indicators. Without confirmation, the Bullish Marubozu might be an isolated price spike without sustained bullish momentum.
- Market Context:
- The Bullish Marubozu is most reliable when it forms after a downtrend or at the bottom of a correction, signaling a potential reversal. In an already established uptrend, the Bullish Marubozu may indicate continued strength, but it is less of a reversal signal and more of a continuation pattern.
8. Bullish Marubozu vs. Other Bullish Candlestick Patterns:
- Bullish Engulfing:
- The Bullish Engulfing pattern consists of two candlesticks: a small red (bearish) candle followed by a larger green (bullish) candle that engulfs the body of the first candle. While both patterns signal bullish reversal, the Bullish Marubozu is considered a more powerful signal because it shows that the bulls maintained control throughout the entire trading session.
- Morning Star:
- The Morning Star is a three-candle reversal pattern that typically forms after a downtrend. It consists of a long bearish candle, followed by a small-bodied candle (often a Doji), and then a long bullish candle. While the Morning Star suggests a reversal, the Bullish Marubozu is more forceful in its indication of sustained buying pressure.
- Three White Soldiers:
- The Three White Soldiers is a three-candle bullish reversal pattern that forms in a downtrend. It consists of three consecutive long bullish candles. While the Bullish Marubozu represents a single decisive move, the Three White Soldiers pattern indicates a sustained buildup of buying pressure over multiple sessions.
9. Key Takeaways:
- The Bullish Marubozu is a single candlestick pattern that indicates strong bullish momentum, with the price moving from the low to the high of the session without significant retracement.
- It is a bullish reversal pattern when it forms after a downtrend, or a bullish continuation pattern when it forms within an uptrend.
- A long body with little to no upper or lower shadows is