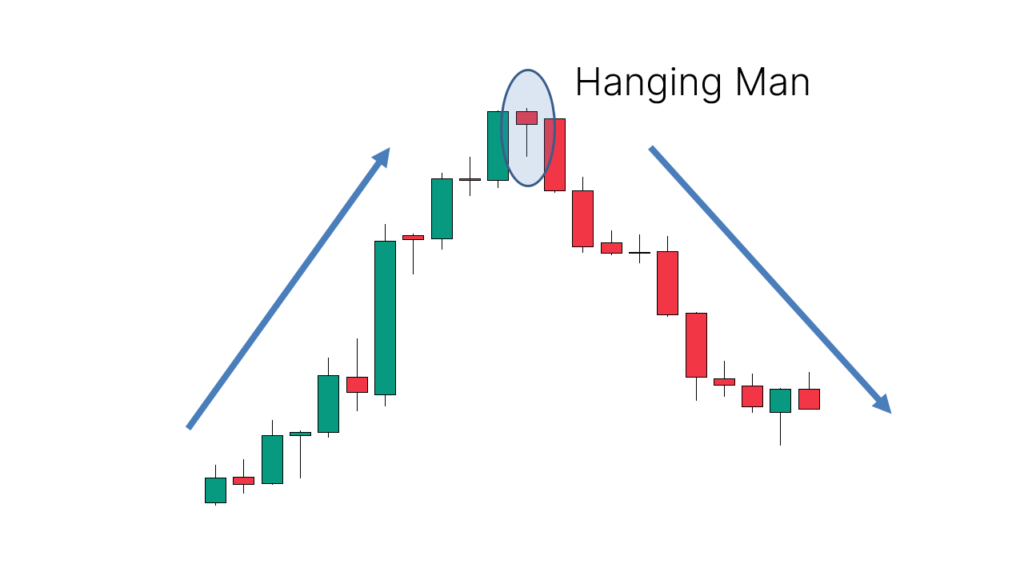
The Hanging Man is a bearish candlestick pattern that occurs after an uptrend and signals potential weakness or a reversal in the market. It’s a single candlestick pattern that looks similar to the Inverted Hammer but has different implications depending on the context in which it appears.
Key Features of the Hanging Man Pattern:
- Small Body:
- The Hanging Man has a small body near the top of the candle. The body can be either bullish (green or white) or bearish (red or black), but the key feature is the small size of the body.
- Long Lower Shadow:
- The candlestick has a long lower shadow (also called a “wick” or “tail”), which is typically at least twice the length of the body.
- The long lower shadow indicates that the price was pushed significantly lower during the trading session but was pulled back up before the close, showing that sellers tried to take control but were unable to sustain the pressure.
- Little or No Upper Shadow:
- The upper shadow is either very short or nonexistent, indicating that the price did not rise much beyond the opening price during the session.
Ideal Context for the Hanging Man:
- The Hanging Man is a reversal pattern that forms at the top of an uptrend, signaling that buying pressure is weakening and a potential reversal or pullback could occur.
- Trend Context: For the pattern to be significant, it should appear after a strong uptrend. In an uptrend, the market has been pushing higher, and the Hanging Man signals that despite initial bullishness, the sellers are starting to gain some control.
Example of the Hanging Man Pattern:
- Imagine a stock that has been rising steadily for several days. On the next day, the price opens higher, rallies during the session, but then falls significantly before closing near the opening price. This forms a candlestick with a small body at the top and a long lower shadow, indicating that while the bulls tried to push the price up, the bears took control and pushed the price down, although the bulls managed to close it near the open.
Interpretation:
- Bearish Reversal Signal: The Hanging Man suggests that, although buyers were initially in control, they were not able to sustain the price increase. The long lower shadow indicates that sellers pushed the price lower during the session, which could be the beginning of a shift in sentiment.
- Indecision: The small body and long lower shadow indicate indecision. The bulls attempted to push prices higher, but the bears fought back and pushed prices lower, although not enough to close at the lows. This indecision could lead to a market reversal or a significant pullback.
- Confirmation is Key: A Hanging Man pattern is more reliable when confirmed by subsequent price action. Traders typically wait for the next candle to confirm a shift in momentum, such as a bearish candle closing lower than the Hanging Man’s body or a break below a key support level.
How to Use the Hanging Man in Trading:
- Confirmation:
- The Hanging Man by itself is a warning sign of potential weakness, but confirmation is key. Traders often wait for the next candle to close lower or for a break of a support level to confirm the reversal.
- A strong bearish candle following the Hanging Man increases the pattern’s reliability as a bearish signal.
- Stop-Loss Placement:
- A common strategy is to place a stop-loss just above the high of the Hanging Man candle (the top of the body or the high of the day). This way, if the market continues to rise, the trade can be exited before significant losses occur.
- Support/Resistance Levels:
- The pattern is more reliable when it forms near resistance levels or after a significant rally. Resistance levels are price points where the market has had difficulty pushing through previously. A Hanging Man at or near a resistance level could signal that the uptrend is losing steam and may reverse.
- Volume:
- Higher volume on the Hanging Man candle suggests stronger conviction in the reversal signal. A Hanging Man with low volume may not be as significant.
Example of the Hanging Man in Context:
- Uptrend: A stock has been rallying strongly for several days or weeks.
- Hanging Man Forms: The price opens higher, moves up during the session, but then falls significantly and closes near the open. This forms a Hanging Man candlestick.
- Bearish Signal: The Hanging Man is formed at the top of the uptrend, signaling that the buying pressure may be waning, and a potential reversal or pullback is coming.
- Confirmation: The following day, the price opens lower and continues to decline, confirming that the market is reversing.
Important Notes:
- False Signals: Like all candlestick patterns, the Hanging Man is not always reliable on its own. It can sometimes produce false signals, especially if it forms during a strong uptrend with no follow-through on the next candles.
- False at the Bottom: If a Hanging Man appears after a downtrend (at the bottom), it is not a valid pattern. If it forms after a downtrend, it is referred to as an Inverted Hammer and has a bullish implication.
- Time Frame: The Hanging Man pattern can appear on any time frame, but it tends to be more significant on higher time frames, like daily or weekly charts, where trends are more established.
Hanging Man vs. Inverted Hammer:
- The Inverted Hammer is the opposite of the Hanging Man. It forms after a downtrend and signals a potential bullish reversal.
- The Hanging Man, on the other hand, appears after an uptrend and signals potential weakness or a bearish reversal.
- Both patterns have the same shape but different implications based on the prevailing trend. The Hanging Man is a bearish signal, while the Inverted Hammer is a bullish signal.
Summary:
The Hanging Man is a bearish reversal candlestick pattern that forms after an uptrend. It has a small body at the top and a long lower shadow, indicating that although the bulls tried to push the price higher, the sellers managed to push it lower during the session, signaling potential weakness. The Hanging Man is considered a warning sign of a reversal, but it requires confirmation through subsequent price action to be more reliable. When combined with other technical indicators, such as volume, trendlines, and support/resistance levels, the Hanging Man can be a powerful tool for identifying potential trend reversals.