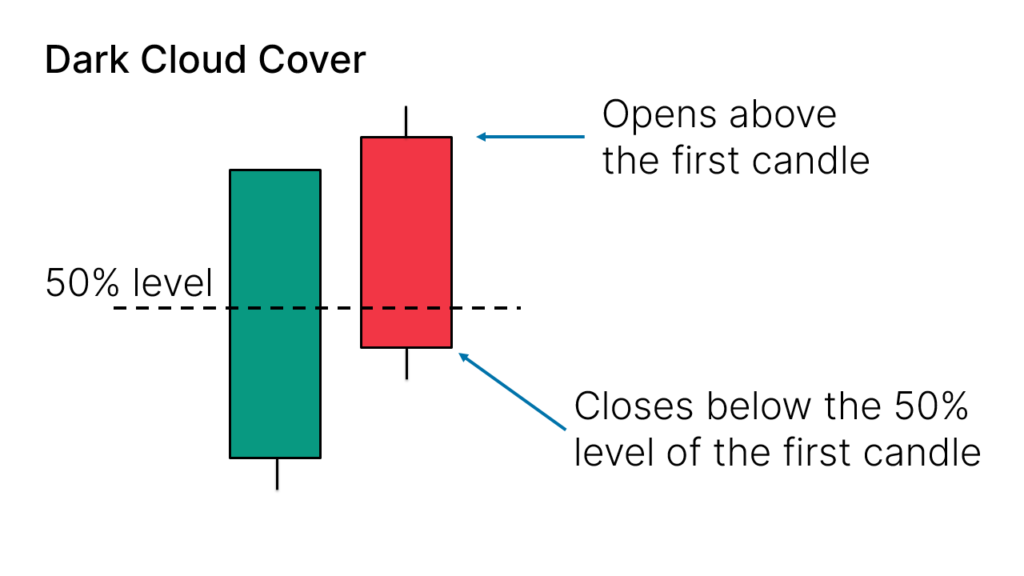
The Dark Cloud Cover is a bearish candlestick pattern that signals a potential reversal or slowdown in an uptrend. It is a two-candle formation that typically appears after an extended period of upward price movement and suggests that the bulls are losing control, and the bears are beginning to take over.
Key Features of the Dark Cloud Cover Pattern:
- First Candle:
- The first candle is a long bullish (white or green) candle, indicating strong upward momentum and that buyers are in control.
- Second Candle:
- The second candle is a long bearish (black or red) candle.
- The second candle opens above the high of the first candle, but it closes below the midpoint of the first candle’s body.
- This indicates that the bears have taken control during the session, with the price opening higher but ultimately closing well below the previous session’s midpoint.
Characteristics of the Dark Cloud Cover Pattern:
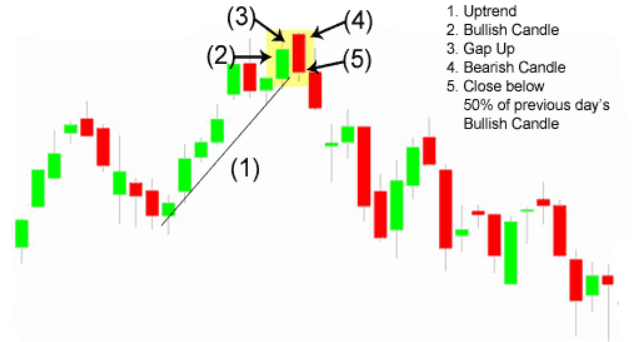
- Trend: The pattern occurs during an uptrend, and it suggests that the momentum of the trend is waning. It signals a shift in market sentiment from bullish to bearish.
- Reversal Signal: The Dark Cloud Cover is a bearish reversal pattern that indicates the potential for the price to reverse to the downside.
- Bearish Confirmation: The second candle must close below the midpoint of the first candle for the pattern to be valid. This is a critical requirement, as it confirms that the sellers are overpowering the buyers.
Example of the Dark Cloud Cover Pattern:
- Imagine a stock is in a strong uptrend, and on the first day, the price rises significantly (long bullish candle). On the second day, the stock opens higher, but by the end of the day, the price falls and closes below the middle of the first candle. This forms a Dark Cloud Cover pattern, indicating that the market sentiment is shifting and the price may begin to fall.
Interpretation:
- Bearish Reversal: The Dark Cloud Cover indicates that the bulls are losing momentum and that the bears may be gaining control. The price action of the second candle suggests that the buyers tried to push the price higher but failed, and the sellers took over, driving the price lower.
- Midpoint Close: The fact that the second candle closes below the midpoint of the first candle’s body is a strong sign that the market sentiment has changed and that a reversal could be underway.
- Market Sentiment Shift: The price action shows that the upward trend may be running out of steam, and the shift from bullish to bearish momentum is happening.
How to Use the Dark Cloud Cover in Trading:
- Confirmation:
- The Dark Cloud Cover pattern by itself is not a guaranteed signal of a reversal. Traders should wait for confirmation in the form of a continuation of the downtrend in the next few candles. A follow-through bearish candle on the day after the Dark Cloud Cover pattern strengthens the bearish signal.
- Volume:
- Higher volume on the second (bearish) candle adds strength to the pattern, indicating that the shift from buying to selling pressure is more significant. Low volume may weaken the signal.
- Stop-Loss Placement:
- Traders may place a stop-loss above the high of the first candle (the bullish candle). If the price moves higher and breaks above the high of the first candle, the pattern may not be valid anymore, and the stop-loss would limit potential losses.
- Support and Resistance:
- The Dark Cloud Cover pattern is stronger when it occurs near a resistance level, as the price is more likely to reverse at these points. If the pattern forms near a key resistance zone, it increases the likelihood of a bearish reversal.
- Time Frame:
- Like all candlestick patterns, the Dark Cloud Cover can form on any time frame, but it is typically more reliable on higher time frames, such as daily or weekly charts, where trends are more established.
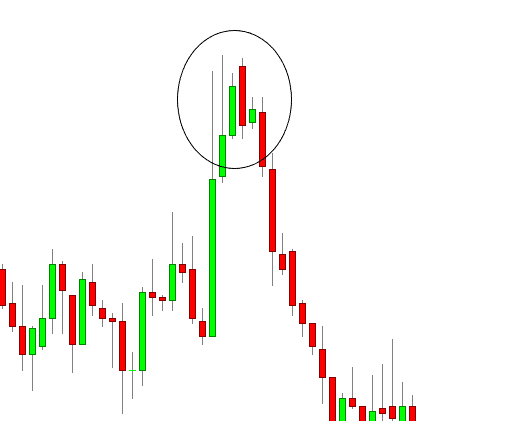
Example of the Dark Cloud Cover in Context:
- Uptrend: A stock has been rising steadily for several days.
- Dark Cloud Cover Forms: On the first day, the stock rises sharply, forming a large bullish candle. The next day, the stock opens higher but then reverses and closes below the midpoint of the previous day’s candle, forming a Dark Cloud Cover pattern.
- Bearish Signal: The Dark Cloud Cover suggests that the uptrend may be coming to an end, and a reversal or significant pullback may occur.
- Confirmation: If the stock continues lower in the next few days, this strengthens the bearish signal of the Dark Cloud Cover.
Differences Between Dark Cloud Cover and Engulfing Patterns:
- The Dark Cloud Cover and the Bearish Engulfing pattern are both bearish reversal patterns, but they have different formations:
- The Dark Cloud Cover consists of two candles: the first is a bullish candle, and the second is a bearish candle that opens above the first but closes below the midpoint of the first candle.
- The Bearish Engulfing pattern also consists of two candles: a small bullish candle followed by a larger bearish candle that completely engulfs the first candle’s body.
- Dark Cloud Cover suggests a shift in momentum, while the Bearish Engulfing pattern shows stronger bearish sentiment, as the second candle fully engulfs the previous one.
Important Notes:
- False Signals: As with all candlestick patterns, the Dark Cloud Cover can sometimes produce false signals. It is important to look for additional confirmation, such as a follow-up bearish candle or the breach of a support level.
- Trend Strength: The reliability of the Dark Cloud Cover increases when it appears after a strong uptrend. If the uptrend has been weak or the price has only been slightly rising, the pattern may not be as significant.
- Time Frame: The pattern tends to be more reliable on longer time frames (like daily or weekly charts) because trends tend to be stronger and more established on those time frames.
Summary:
The Dark Cloud Cover is a bearish reversal candlestick pattern that occurs after an uptrend, signaling a potential change in market sentiment from bullish to bearish. It consists of two candles: the first is a long bullish candle, and the second is a long bearish candle that opens above the high of the first but closes below its midpoint. For the pattern to be considered valid, the second candle must close below the midpoint of the first. This indicates a shift in momentum, suggesting that the uptrend may be weakening and a downtrend or pullback could follow. As with all candlestick patterns, the Dark Cloud Cover is more reliable when confirmed by subsequent price action or other technical indicators.