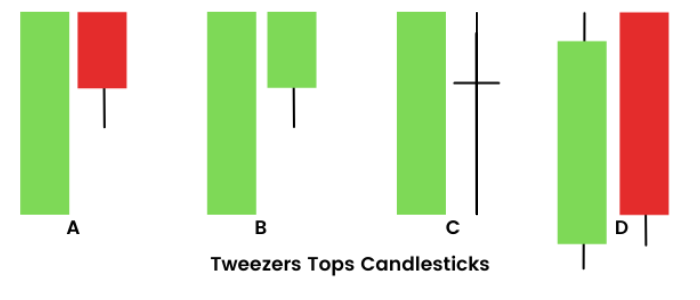
The Tweezer Top is a bearish reversal candlestick pattern that typically appears at the end of an uptrend. It signals that the price may soon reverse or experience a pullback. The pattern is formed by two candles: the first is a bullish candle (usually a strong one), and the second is a bearish candle. The key feature of this pattern is that both candles have identical highs, creating a “tweezer” effect, which is why it’s called the Tweezer Top.
Key Features of the Tweezer Top Pattern:
- Two Candles:
- The Tweezer Top pattern consists of two candles:
- The first candle is typically a strong bullish (green or white) candle, indicating continued buying pressure.
- The second candle is a bearish (red or black) candle that closes lower than the previous candle, indicating that selling pressure has emerged and the trend may be reversing.
- Identical Highs:
- The most important feature is that the highs of both candles are at the same level (or very close to it), which creates the “tweezer” appearance.
- The identical highs suggest that the bulls were unable to push the price higher, and the bears were able to step in and halt further upside movement.
- Bearish Reversal Signal:
- The pattern indicates that the uptrend might be ending, and a downtrend or at least a pullback could follow. The second candle in the pattern (the bearish one) is typically larger or at least equal in size to the first candle, confirming the reversal.
- Trend Context:
- The Tweezer Top is most significant when it occurs after an extended uptrend. If the pattern forms in a strong uptrend, it is seen as a reversal signal, suggesting that the upward momentum is losing steam and a pullback or full trend reversal is likely.
- A Tweezer Top can also signal exhaustion of the buying pressure in the market.
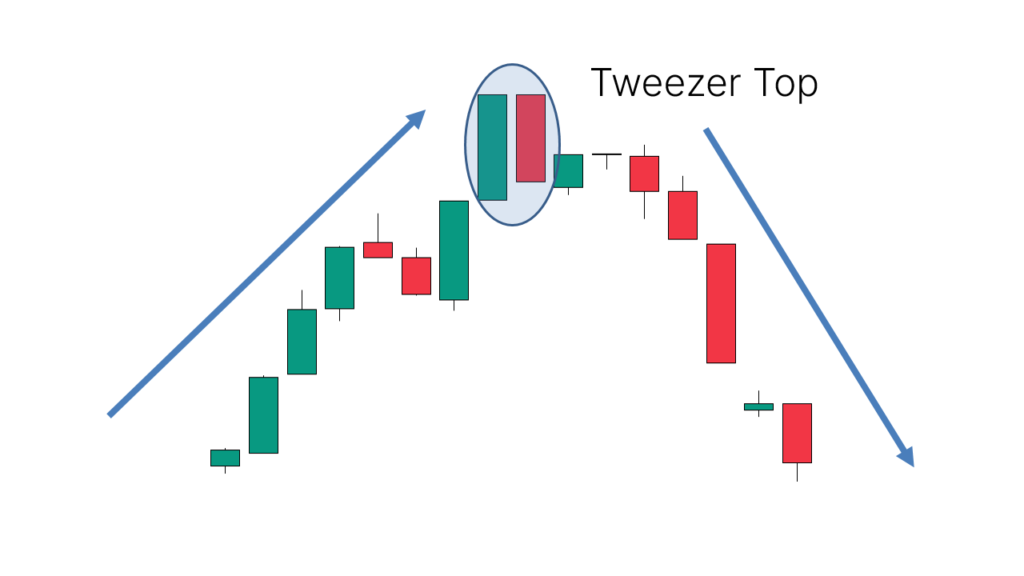
Example of the Tweezer Top Pattern:
- Uptrend: The price has been rising steadily, and a strong bullish candle forms.
- Tweezer Formation: The following day, the price opens and rises to the same high as the previous day but then fails to continue higher and closes lower, forming a bearish candle with the same high.
- Bearish Reversal: The Tweezer Top pattern signals that the bulls were unable to sustain the uptrend, and the market may now reverse or experience a pullback.
Interpretation:
- Reversal Signal: The Tweezer Top is a bearish reversal pattern, suggesting that after the formation of two candles with identical highs, the uptrend is likely to end and a downtrend may follow.
- Exhaustion of Buying Pressure: The pattern reflects buyer exhaustion. Although the market was bullish (as indicated by the first candle), the failure to push beyond the same high on the second candle signals a shift in sentiment, with sellers starting to take control.
- Bearish Confirmation: The second bearish candle should ideally close lower than the first candle, confirming that the bears are now in control.
How to Use the Tweezer Top in Trading:
- Wait for Confirmation:
- A Tweezer Top pattern is more reliable if it is followed by a confirmation candle—usually a strong bearish candle that closes below the low of the second candle. This confirms that the reversal is indeed occurring.
- Traders may also look for a break below support (such as a trendline or moving average) as additional confirmation.
- Volume:
- The volume should be considered when assessing the Tweezer Top pattern. Higher volume on the second candle adds strength to the reversal signal. If the second candle is formed with low volume, the signal may be weaker.
- A significant increase in volume on the bearish candle suggests strong selling interest, increasing the likelihood of a trend reversal.
- Stop-Loss Placement:
- If entering a short position based on the Tweezer Top pattern, it’s common to place a stop-loss order just above the high of the second candle (the high of the Tweezer Top). This way, if the price continues to rise, the trade is exited to prevent further loss.
- Support/Resistance:
- The Tweezer Top is more reliable when it forms near a key resistance level, such as a previous price high, a trendline, or a moving average that has acted as resistance in the past.
- If the pattern forms at or near a resistance zone, it suggests that the price has hit a barrier and that the bulls are losing their ability to push the price higher.
- Time Frame:
- The Tweezer Top can form on any time frame, but it is generally more reliable on higher time frames (such as daily or weekly charts) where trends are more established. The longer the trend, the more significant the reversal signal.
Example of the Tweezer Top in Context:
- Uptrend: A stock is in a strong uptrend and has been making new highs.
- First Candle: A large bullish (green or white) candle forms, suggesting strong buying pressure.
- Second Candle: The next day, the stock opens higher, rises to the same high as the first candle, but then falls and closes lower, forming a bearish (red or black) candle.
- Bearish Signal: The Tweezer Top signals that the market is losing momentum and the price may soon start to reverse lower.
- Confirmation: Traders might wait for the next few candles to confirm the reversal. If the price breaks below support, it confirms the pattern and strengthens the bearish signal.
Differences Between Tweezer Top and Other Bearish Patterns:
- Tweezer Top vs. Bearish Engulfing:
- The Bearish Engulfing pattern consists of two candles: a smaller bullish candle followed by a larger bearish candle that completely engulfs the first candle’s body. In contrast, the Tweezer Top has two candles with identical highs and is not as focused on the size of the second candle engulfing the first.
- The Bearish Engulfing suggests stronger bearish sentiment, while the Tweezer Top signals indecision and exhaustion after a strong uptrend.
- Tweezer Top vs. Dark Cloud Cover:
- The Dark Cloud Cover is a two-candle pattern where the second candle opens above the first and closes below its midpoint, indicating that the market has failed to maintain its bullish momentum. The Tweezer Top, on the other hand, occurs when two candles have identical highs, showing that the bulls have failed to push the price higher at the top of an uptrend.
Important Notes:
- False Signals: As with any candlestick pattern, the Tweezer Top can produce false signals, particularly in volatile or trending markets. To reduce the likelihood of a false signal, wait for confirmation, such as a strong bearish candle or a break of support.
- Risk Management: Always use proper risk management strategies when trading based on the Tweezer Top, especially if the market does not immediately reverse after the pattern forms. The pattern is more reliable in the context of a larger trend or in conjunction with other technical indicators.
Summary:
The Tweezer Top is a bearish reversal candlestick pattern that consists of two candles with identical highs. It typically forms after an uptrend and signals a potential reversal to the downside. The first candle is a strong bullish candle, and the second is a bearish candle, indicating that the buyers were unable to push the price higher. The pattern suggests that the market may be exhausted and that the bears may be starting to take control. Confirmation through subsequent price action (such as a break of support or additional bearish candles) is important for increased reliability. The Tweezer Top is most effective when it forms near a resistance level, adding to the likelihood of a reversal.