The Spinning Top is a candlestick pattern characterized by a small body and long upper and lower shadows, similar to a Doji, but with a larger body. It represents a period of indecision in the market, where neither buyers nor sellers are fully in control, but there is more of a balance between the two sides compared to a Doji. The Spinning Top indicates a pause or hesitation in the market, which may suggest a potential reversal or consolidation, depending on the trend context.
Key Features of the Spinning Top:
- Small Body:
- The body of the Spinning Top is relatively small, meaning that the open and close prices are close to each other. The small body indicates indecision in the market, where the closing price is near the opening price.
- The body of the candlestick can be either bullish (green or white) or bearish (red or black), but it’s the size of the body (small compared to the wicks) that is most important.
- Long Shadows:
- The Spinning Top has long upper and lower shadows (wicks), indicating that both bulls and bears had control at different times during the trading period. The long shadows show that price action moved significantly higher and lower during the session, but ultimately neither side was able to maintain the move.
- The length of the shadows can vary, but they are typically at least twice the length of the body, signaling that significant price movement occurred in both directions during the period.
- Indecision:
- A Spinning Top suggests market indecision, with no clear winner between buyers and sellers. It often forms after a strong trend (either up or down), signaling that the market is uncertain about the next move.
- It can signal either a pause in the current trend or a potential reversal, but it is often inconclusive on its own. Confirmation from subsequent candles is typically needed.
Types of Spinning Top:
- The Spinning Top pattern can form as either a bullish or bearish candle, depending on whether the price closes higher or lower than it opened:
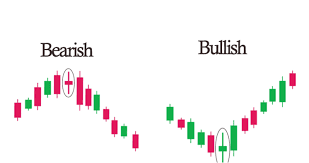
- Bullish Spinning Top: If the candle closes slightly higher than it opened, it is a bullish Spinning Top.
- Bearish Spinning Top: If the candle closes slightly lower than it opened, it is a bearish Spinning Top.
Interpretation of the Spinning Top:
- Trend Context:
- The trend leading up to the Spinning Top is crucial for interpretation:
- In an uptrend, a Spinning Top can suggest that buying momentum is slowing down, and a reversal or consolidation might occur.
- In a downtrend, a Spinning Top indicates that selling pressure may be weakening, and a reversal or consolidation to the upside could follow.
- Indecision:
- The pattern represents a battle between buyers and sellers, but neither side has been able to establish dominance by the end of the trading period. This suggests that the market is unsure about its next direction.
- If a Spinning Top appears after a strong trend, it is often seen as a signal of exhaustion, meaning that the prevailing trend may be losing steam and could reverse or pause.
- Reversal or Continuation?:
- The Spinning Top can signal either a reversal or continuation:
- Reversal: If it forms after an extended trend (either up or down), it may suggest that the trend is losing momentum and that a reversal could occur. A confirmation candle in the opposite direction is typically needed to confirm this.
- Continuation: If it occurs during a consolidation phase or in a trading range, the pattern may just represent a pause before the current trend continues.
- Volume:
- Volume analysis is important when interpreting a Spinning Top. A Spinning Top with higher volume may signal stronger indecision, whereas one with low volume might suggest a lack of interest and may not be a strong signal.
- A Spinning Top at a key support or resistance level may have increased significance, as it indicates indecision at a critical price level and could precede a breakout in either direction.
Trading Strategies with the Spinning Top:
- As a Reversal Signal:
- When a Spinning Top appears after a strong trend (either up or down), it may indicate that the trend is weakening and could reverse. However, confirmation is critical:
- For a bearish reversal, look for a strong bearish candle following a bullish Spinning Top in an uptrend.
- For a bullish reversal, wait for a strong bullish candle after a bearish Spinning Top in a downtrend.
- The Spinning Top by itself is a neutral pattern, so traders typically wait for confirmation through subsequent price action.
- As a Continuation Signal:
- If the Spinning Top forms during a sideways market or in a consolidation phase, it may suggest that the market is simply pausing before continuing in the same direction.
- Look for breakouts above resistance or below support to confirm the continuation. In this case, the Spinning Top can be seen as a bullish continuation pattern (in an uptrend) or a bearish continuation pattern (in a downtrend).
- Stop-Loss Placement:
- When trading based on a Spinning Top pattern, a common risk management strategy is to place a stop-loss order just beyond the extremes of the pattern, either above the upper shadow or below the lower shadow, to protect against false breakouts or reversals.
- Confirm with Other Indicators:
- As a neutral pattern, the Spinning Top works best when combined with other technical indicators or chart patterns. For example, look for divergence in momentum indicators (e.g., RSI or MACD) to confirm a reversal or continuation.
Example of Spinning Top in Context:
- Uptrend:
- The price has been rising for several days. A Spinning Top forms, showing that while the price moved higher and lower during the session, neither the buyers nor the sellers were able to dominate. This indicates indecision.
- After the Spinning Top, a strong bearish candle forms, confirming that the trend might be reversing. A trader might consider shorting the market after this confirmation.
- Downtrend:
- The price has been falling steadily. A Spinning Top forms, suggesting that selling pressure is weakening. This could indicate that the downtrend is losing momentum and that a reversal could be coming.
- If the next candle is bullish, confirming the reversal, the trader might enter a long position.
- Consolidating Market:
- The price has been moving sideways in a range-bound market. A Spinning Top forms after the price has briefly moved up and down, indicating indecision. The next candle breaks out above resistance, confirming the continuation of the previous uptrend.
- Traders might look to buy once the breakout is confirmed.
Differences Between the Spinning Top and Other Candlestick Patterns:
- Spinning Top vs. Doji:
- The Doji has an even smaller body, with the open and close at the same price or very close. It reflects stronger indecision than the Spinning Top, which has a slightly larger body.
- The Doji often signals more extreme indecision, whereas the Spinning Top suggests a moderate level of indecision.
- Spinning Top vs. Hammer:
- A Hammer candlestick typically has a small body at the top with a long lower shadow, indicating a potential reversal after a downtrend. In contrast, the Spinning Top has a small body centered between long upper and lower shadows, indicating indecision.
- The Hammer is typically seen as a bullish reversal after a downtrend, whereas the Spinning Top could indicate a pause in the current trend or a potential reversal, depending on its position.
- Spinning Top vs. Engulfing Patterns:
- Engulfing patterns are typically more decisive than the Spinning Top. A Bullish Engulfing pattern indicates that buyers have taken control and reversed the trend, whereas a Spinning Top suggests that neither side is in control.
- An Engulfing pattern provides more clarity regarding direction, while a Spinning Top requires confirmation through subsequent price action.
Important Notes:
- False Signals: The Spinning Top pattern can sometimes produce false signals, especially if it appears in a market with low volatility or if confirmation is lacking. Traders should not rely solely on the Spinning Top but should wait for further confirmation from subsequent candles or technical indicators.
- Market Context: The significance of the Spinning Top depends largely on the broader market context (e.g., trend, support and resistance levels, nearby chart patterns). A Spinning Top is more meaningful when it occurs at the top or bottom of a trend or at key support/resistance levels.
Summary:
The Spinning Top is a candlestick pattern that indicates market indecision, with a small body and long upper and lower shadows. It suggests that buyers and sellers are in equilibrium, and the market is uncertain about its next move. The pattern can signal either a potential reversal or a pause in the current trend, depending on its context. To increase reliability, traders typically wait for confirmation from subsequent price action or other technical indicators. The Spinning Top is a neutral pattern and should