The Long-Legged Doji is a specific type of Doji candlestick pattern characterized by a small body and long upper and lower shadows (wicks). This pattern signifies a high level of market indecision because it shows that both buyers and sellers had control at different points during the trading session, but neither side was able to maintain control by the close.
The Long-Legged Doji is particularly notable for its extended shadows, which show that price moved significantly up and down, but the opening and closing prices are virtually the same, indicating that neither the bulls nor the bears were able to push the price in any particular direction by the end of the session.
Key Features of a Long-Legged Doji:
- Small Body:
- The body of the Long-Legged Doji is very small, with the open and close prices being very close to each other. This small body reflects the indecision between the buyers and sellers, as neither side was able to move the price decisively in their direction.
- Long Upper and Lower Shadows:
- The Long-Legged Doji is characterized by long upper and lower shadows (wicks), often indicating that there was significant price movement both upward and downward during the session. The shadows should ideally be at least twice the length of the body, but in some cases, they may be much longer.
- These long wicks suggest that there was volatility in the session, but it ultimately resulted in a neutral close, meaning that neither the buyers nor the sellers were able to establish control by the end of the period.
- Indecision:
- The pattern represents a battle between bulls and bears, where both sides had their moments, but neither could win by the close. The small body and long shadows indicate that the market was in a state of uncertainty or indecision.
How to Interpret the Long-Legged Doji:
The Long-Legged Doji is often considered a neutral candlestick pattern. However, its interpretation depends heavily on the context in which it appears:
- Indecision:
- The primary message of the Long-Legged Doji is that the market is undecided, with neither the buyers nor the sellers gaining the upper hand. This can occur after a strong trend, and the pattern may suggest that the trend is losing momentum or that the market is preparing for a consolidation or reversal.
- Possible Reversal:
- If the Long-Legged Doji appears after an uptrend, it may signal that the bulls are losing their grip, and a reversal to the downside could be forthcoming. Similarly, if it forms after a downtrend, it could indicate that the bears are losing control, and a bullish reversal could be on the horizon.
- However, the Long-Legged Doji by itself is not a strong reversal signal. Traders typically wait for confirmation from the next candlestick or additional technical indicators to confirm whether a reversal will occur.
- Consolidation:
- A Long-Legged Doji can also indicate consolidation or a pause in the market. It suggests that the price is in a state of balance and that a breakout might occur in either direction. In this case, traders might look for a breakout above resistance or below support to confirm the market’s next move.
- Contextual Analysis:
- The significance of a Long-Legged Doji increases when it appears at key levels, such as at support or resistance, or after a strong trend. In these situations, it can act as a warning sign that the trend may be weakening or about to reverse. However, without further confirmation, it should not be viewed as a definitive signal.
Trading Strategies with the Long-Legged Doji:
- Reversal Signal:
- When a Long-Legged Doji appears after a trend, it could be signaling that the trend is losing strength. For example:
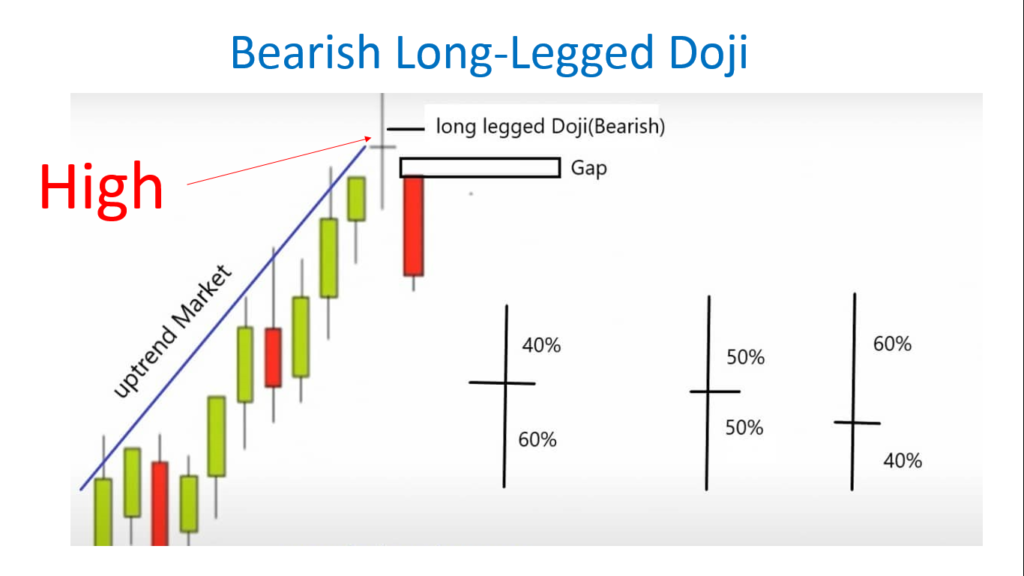
- After an uptrend: A Long-Legged Doji can suggest that the market is undecided and might be preparing for a potential reversal to the downside. A bearish confirmation candle (such as a red candlestick that closes lower) would strengthen the reversal signal.
- After a downtrend: The Long-Legged Doji could indicate that selling pressure is waning, and the price may reverse to the upside. A bullish confirmation candle (such as a green candlestick that closes higher) would suggest the potential for a bullish reversal.
- Consolidation/Range-Bound Market:
- In a range-bound or sideways market, a Long-Legged Doji can indicate indecision within the established support and resistance levels. Traders may look for a breakout above resistance or below support to indicate the direction of the next trend.
- Waiting for Confirmation:
- The Long-Legged Doji is best used in conjunction with other technical indicators or price action patterns. A confirmation candle (either bullish or bearish) after the Doji is critical to validate the signal and avoid false signals.
- Confirmation might include price action like a breakout, a trendline break, or signals from other indicators (e.g., RSI, MACD).
- Stop-Loss and Target:
- When trading based on a Long-Legged Doji, a common risk management strategy is to place a stop-loss just above the high (for a bearish trade) or below the low (for a bullish trade) of the Long-Legged Doji’s candle. This ensures that if the price moves against your position, your risk is limited.
- Traders might set a profit target based on support/resistance levels, retracement levels, or other key technical zones.
Example of Long-Legged Doji in Context:
- After an Uptrend:
- The market has been rising steadily. A Long-Legged Doji forms at the top of the trend, signaling that the price has moved significantly higher and lower during the session, but neither the buyers nor the sellers were able to establish control by the close.
- Traders might wait for the next candlestick to confirm the reversal. If a bearish candlestick forms after the Doji, this could signal that the uptrend is losing strength, and a reversal to the downside is likely.
- After a Downtrend:
- The price has been falling for several periods, and a Long-Legged Doji forms at the bottom. This pattern suggests that the downward momentum is weakening, and the market is undecided.
- If a bullish candlestick forms after the Doji, it could signal that the bears are losing control, and a bullish reversal could follow.
- Consolidation:
- The market has been moving sideways, and a Long-Legged Doji forms in the middle of the consolidation range. This pattern could indicate that the price is preparing for a breakout, but the direction is uncertain. Traders might wait for a break of support or resistance to confirm the next move.
Differences Between the Long-Legged Doji and Other Doji Patterns:
- Long-Legged Doji vs. Standard Doji:
- A Standard Doji has a small body and relatively short shadows, indicating that the market is in indecision but without significant price movement up or down. It is often more neutral than a Long-Legged Doji.
- The Long-Legged Doji has longer shadows and indicates a greater level of price movement during the period, showing that the market experienced significant volatility before closing at or near the open price.
- Long-Legged Doji vs. Gravestone Doji:
- A Gravestone Doji forms when the open and close are near the low of the session, with a long upper shadow, indicating that buyers tried to push the price higher but ultimately lost control. It is a bearish reversal signal when it appears after an uptrend.
- The Long-Legged Doji has long shadows in both directions and is less specific in terms of a reversal. It represents overall indecision, whereas the Gravestone Doji tends to be more decisive in signaling a potential reversal to the downside.
- Long-Legged Doji vs. Dragonfly Doji:
- The Dragonfly Doji has a long lower shadow, with the open and close near the high of the session. It suggests bullish reversal potential after a downtrend, as it shows that buyers regained control by the close.
- The Long-Legged Doji, on the other hand, has long shadows in both directions, showing indecision without favoring one side or the other, making it a less definitive signal for a reversal.
Important Notes:
- False Signals: The Long-Legged Doji can sometimes produce false signals, especially if it occurs during periods of low volatility or when the market is in a range-bound phase. It is important to wait for additional confirmation from the next candlestick or other technical indicators to confirm its implications.
- Context: The significance of the Long-Legged Doji greatly depends on where it forms in the trend. For example, a Long-Legged Doji at a major support or resistance level has more potential to signal a reversal than one that appears in the middle of an ongoing trend.
Summary:
The **Long
-Legged Doji** is a candlestick pattern that indicates market indecision. It is characterized by a small body and long upper and lower shadows, suggesting that both buyers and sellers were active during the session, but neither side was able to push the price in any direction by the close. The Long-Legged Doji is often a signal of potential reversal or consolidation, but it requires confirmation from subsequent price action or other indicators to provide a more reliable signal.