The Belt Hold is a candlestick pattern that signals potential trend continuation or trend reversal, depending on its position within the market. It is characterized by a long-bodied candle (either bullish or bearish) with little to no shadow on the opposite side of the body. The Belt Hold pattern can be seen as a strong indication of market sentiment and momentum, and it is more reliable when it appears after a previous trend or in conjunction with other technical indicators.
Key Features of the Belt Hold Pattern:
- Bullish Belt Hold:
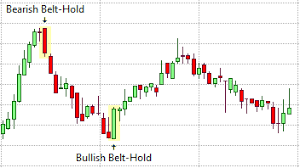
- A bullish Belt Hold occurs during a downtrend and is characterized by a long white (or green) candle that opens near the low of the session and closes near the high.
- The candlestick has little to no upper shadow and a very small or no lower shadow, suggesting that buyers took control of the market right from the opening and pushed the price higher throughout the session.
- This pattern indicates strong bullish sentiment and a potential reversal from the downtrend, or at least a temporary shift in momentum.
- Bearish Belt Hold:
- A bearish Belt Hold occurs during an uptrend and is characterized by a long black (or red) candle that opens near the high of the session and closes near the low.
- Similar to the bullish version, this candle has little to no lower shadow and a very small or no upper shadow, indicating that sellers took control of the market from the opening price and drove the price lower throughout the session.
- The bearish Belt Hold suggests strong bearish sentiment and may signal a reversal to the downside or at least a shift in momentum after an uptrend.
Interpretation of the Belt Hold Pattern:
- Bullish Belt Hold (After a Downtrend):
- The bullish Belt Hold represents a reversal from a downtrend. The long green or white candle shows that buyers were able to overpower sellers and drive the price significantly higher from the opening price. It indicates that the market sentiment has changed from bearish to bullish, and there could be further upward momentum.
- This pattern is more reliable when it occurs near support levels or after a prolonged downtrend, as it suggests the market is rejecting lower prices and buyers are entering the market in force.
- Traders might consider entering a long position (buy) after the bullish Belt Hold, especially if the subsequent candles confirm the trend continuation.
- Bearish Belt Hold (After an Uptrend):
- The bearish Belt Hold indicates a reversal from an uptrend. The long red or black candle shows that sellers took control of the market right from the opening, pushing the price significantly lower. This suggests a potential shift in market sentiment from bullish to bearish.
- Like the bullish version, the bearish Belt Hold is more reliable when it occurs near resistance levels or after an extended uptrend, signaling that the price might be rejecting higher levels and a bearish reversal could follow.
- Traders might consider entering a short position (sell) after the bearish Belt Hold if the following candles confirm the downtrend.
- Trend Continuation:
- If the Belt Hold pattern forms within an existing trend (either bullish or bearish), it can also be interpreted as a signal of trend continuation. The strong movement in the direction of the prevailing trend (whether bullish or bearish) suggests that the trend is likely to continue, and there is strong momentum behind it.
- A bullish Belt Hold in an uptrend, or a bearish Belt Hold in a downtrend, might indicate that the trend is still in control, and the price could continue in the same direction.
- Confirmation:
- The confirmation candle is important for validating the Belt Hold pattern. For example, after a bullish Belt Hold, a bullish follow-up candle (another green candle) confirms that the bullish momentum is likely to continue. After a bearish Belt Hold, a bearish follow-up candle (a red candle) supports the likelihood of the reversal or trend continuation to the downside.
Volume Considerations:
- Volume can enhance the reliability of the Belt Hold pattern:
- For a bullish Belt Hold, increased volume during the formation of the candle suggests strong buying interest and may confirm the reversal or trend continuation.
- For a bearish Belt Hold, higher volume can indicate that sellers are entering the market with conviction and may strengthen the bearish reversal signal.
Trading Strategy with the Belt Hold Pattern:
- Bullish Belt Hold (After a Downtrend):
- Entry: Enter a long position (buy) after a bullish Belt Hold, especially if the following candle confirms the reversal (i.e., a bullish candle follows).
- Stop-Loss: Place a stop-loss below the low of the Belt Hold candle to protect against a false reversal.
- Target: The price target can be based on resistance levels, Fibonacci retracements, or recent highs.
- Bearish Belt Hold (After an Uptrend):
- Entry: Enter a short position (sell) after a bearish Belt Hold, especially if the next candle confirms the reversal (i.e., a bearish candle follows).
- Stop-Loss: Place a stop-loss above the high of the Belt Hold candle to protect against a continuation of the uptrend.
- Target: Set the profit target based on support levels, recent lows, or other technical indicators.
- Trend Continuation:
- In cases where the Belt Hold appears as part of an ongoing trend (either bullish or bearish), the trader may choose to ride the trend. The entry is made after the Belt Hold, with stop-loss placed according to trend lines or key support/resistance levels.
- Volume should be monitored for signs of momentum, and the trader may exit when signs of trend exhaustion or reversal appear.
Example of Bullish Belt Hold:
- Scenario: After a prolonged downtrend, the market forms a long green candle that opens near the low and closes near the high, with no upper shadow and a small lower shadow (or none at all). This bullish Belt Hold suggests that buyers have regained control and that a potential reversal to the upside could be underway. Traders may enter long positions, anticipating a bullish trend reversal.
Example of Bearish Belt Hold:
- Scenario: After a strong uptrend, the market forms a long red candle that opens near the high and closes near the low, with no lower shadow and a small upper shadow (or none at all). This bearish Belt Hold signals that sellers have taken control and the market may reverse downward. Traders may enter short positions, anticipating a bearish reversal.
Summary:
The Belt Hold pattern is a single candlestick pattern that can signal either a bullish reversal (in a downtrend) or a bearish reversal (in an uptrend), depending on the color of the candle. It is characterized by a long-bodied candle with little or no shadow on the opposite side of the body. The pattern is more reliable when it appears after a strong trend and near support (for bullish reversal) or resistance (for bearish reversal). Volume can be a confirming factor in validating the strength of the pattern. Traders use the Belt Hold to enter long or short positions, depending on the direction of the reversal or continuation.