The Inside Bar is a popular candlestick pattern used by traders to identify periods of market consolidation and potential trend continuation or reversal. It occurs when a candlestick (the “inside bar”) is completely contained within the range of the previous candlestick (the “mother bar”). This pattern typically indicates indecision in the market, with buyers and sellers in a standoff, and can signal a breakout in either direction, depending on subsequent price action.
Key Features of the Inside Bar:
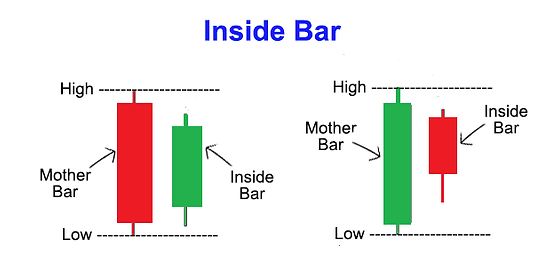
- Mother Bar:
- The Mother Bar is the first candle in the pattern and is usually a relatively large candlestick, showing that there was significant price movement within that timeframe.
- The body of the mother bar defines the range between its open and close, while the high and low of the mother bar form the price boundaries.
- Inside Bar:
- The Inside Bar (the second candle) is a smaller candlestick whose open, high, low, and close are entirely within the range of the mother bar.
- The inside bar shows a period of consolidation or indecision, where the market trades in a tighter range than the previous period, indicating a potential breakout or continuation of the trend.
- Range:
- The key defining characteristic of the Inside Bar is that its entire range (high to low) is contained within the range of the mother bar. This means the inside bar’s high must be lower than the mother bar’s high, and the inside bar’s low must be higher than the mother bar’s low.
How to Interpret the Inside Bar:
- Consolidation Phase:
- The Inside Bar suggests that the market is in a consolidation phase, where price action is narrowing, and there is a battle between buyers and sellers. This period of indecision typically comes after a strong price movement in either direction, whether it’s an uptrend or downtrend.
- Traders interpret the Inside Bar as a pause in the trend, with the expectation that price will eventually break out of this consolidation phase.
- Potential for Breakout:
- The Inside Bar pattern is often viewed as a potential breakout signal. After the consolidation, the price is likely to break either above the mother bar’s high or below the mother bar’s low.
- A bullish breakout occurs if the price breaks above the high of the mother bar, indicating that buying pressure has returned and the uptrend may resume.
- A bearish breakout occurs if the price breaks below the low of the mother bar, indicating that selling pressure has taken control, and the downtrend may continue.
- Trend Continuation or Reversal:
- If the Inside Bar forms after a strong uptrend, a breakout above the high of the mother bar is typically seen as a continuation of the uptrend.
- If the Inside Bar forms after a strong downtrend, a breakout below the low of the mother bar is often viewed as a continuation of the downtrend.
- In some cases, the Inside Bar can also signal a trend reversal if it forms at the top of an uptrend (a bearish reversal) or at the bottom of a downtrend (a bullish reversal).
- Confirmation:
- The breakout from the Inside Bar is usually the confirmation signal. Traders typically wait for the price to break the high or low of the mother bar to enter a position. For additional confirmation, traders often look for increased volume or a strong follow-up candle.
- A false breakout can occur if the price moves briefly above or below the range of the mother bar but then quickly returns inside the range. To minimize risk, traders often wait for the price to close decisively above or below the range.
Types of Inside Bar Patterns:
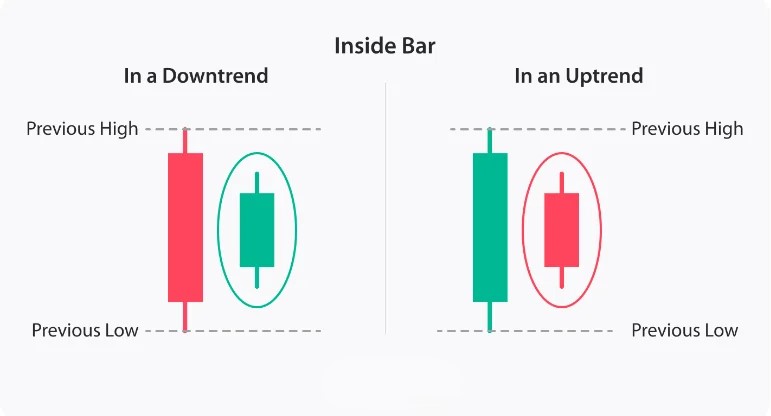
- Inside Bar in an Uptrend:
- When the Inside Bar forms after a significant uptrend, it typically signals a continuation pattern, suggesting that the bulls are temporarily taking a breather before continuing the uptrend.
- A breakout above the high of the mother bar would confirm the continuation of the uptrend.
- Inside Bar in a Downtrend:
- When the Inside Bar forms after a downtrend, it suggests that the bears are pausing and price may continue moving lower after consolidation.
- A breakout below the low of the mother bar confirms the continuation of the downtrend.
- Inside Bar at Market Extremes:
- If the Inside Bar appears at support in a downtrend or at resistance in an uptrend, it can signal a potential trend reversal. For example:
- At support, a bullish breakout above the high of the mother bar could signal the start of an uptrend.
- At resistance, a bearish breakout below the low of the mother bar could signal the continuation of a downtrend.
- Inside Bar with Multiple Bars (Inside Bar Cluster):
- Sometimes, multiple Inside Bars form in sequence, creating an Inside Bar cluster. This indicates a period of prolonged consolidation, and the breakout once it occurs is typically considered stronger and more significant.
Volume Considerations:
- Volume can provide useful insights when trading the Inside Bar pattern:
- A breakout accompanied by increased volume is typically more reliable because it shows stronger participation in the direction of the breakout.
- If the breakout occurs with low volume, it might indicate a weak or false breakout, and traders should be cautious.
Trading Strategy with the Inside Bar:
- Entry Point:
- Buy if the price breaks above the high of the mother bar.
- Sell if the price breaks below the low of the mother bar.
- Ideally, enter the trade after a confirmed breakout with strong follow-through or increased volume.
- Stop-Loss:
- Place a stop-loss just below the low of the Inside Bar for a long position (buy).
- Place a stop-loss just above the high of the Inside Bar for a short position (sell).
- Alternatively, a trader might place the stop-loss below or above the mother bar’s low or high for added protection.
- Target:
- Profit targets can be set based on support/resistance levels, recent highs/lows, or Fibonacci extensions.
- Traders can also use a risk-to-reward ratio (such as 2:1 or 3:1) to determine their exit points.
- False Breakouts:
- A false breakout occurs when the price breaks out above or below the mother bar’s range but quickly reverses. Traders can protect themselves from false breakouts by waiting for a close above or below the range (rather than just an intraday breakout).
Example of Inside Bar in an Uptrend:
- Scenario: After a strong uptrend, the market consolidates and forms an Inside Bar. The price range of the Inside Bar is entirely within the range of the previous candlestick (mother bar). Traders wait for a breakout above the high of the Inside Bar to enter a long position, anticipating that the uptrend will resume.
Example of Inside Bar in a Downtrend:
- Scenario: The market has been trending lower, and an Inside Bar forms. The price range of the Inside Bar is within the range of the previous candlestick. Traders wait for a breakout below the low of the Inside Bar to enter a short position, expecting the downtrend to continue.
Example of Inside Bar as a Reversal Pattern:
- Scenario: The market is in an uptrend, and an Inside Bar forms at a significant resistance level. A breakout below the Inside Bar could indicate that the resistance has held and that a reversal to the downside is likely. Traders may enter short positions as a bearish reversal pattern forms.
Summary:
The Inside Bar is a versatile candlestick pattern that signals periods of market consolidation, typically following a trend. It consists of a smaller candle (inside bar) entirely contained within the range of a larger preceding candle (mother bar). The pattern indicates potential for a breakout, which could result in a trend continuation or trend reversal, depending on the direction of the breakout. Traders typically look for confirmation through volume and subsequent price action before entering trades.