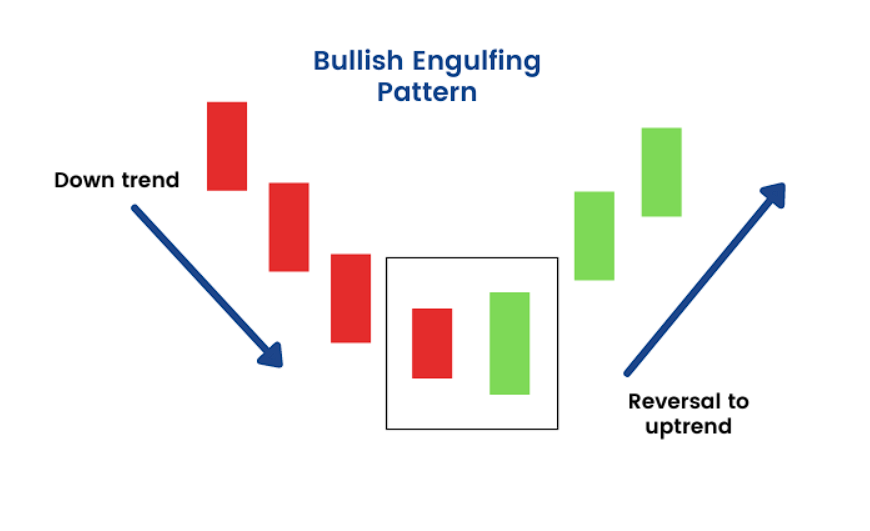
The Bullish Engulfing pattern is a two-candle reversal pattern that signals a potential trend reversal from a downtrend to an uptrend. It consists of two candles: a smaller bearish (down) candle followed by a larger bullish (up) candle that “engulfs” or fully covers the body of the previous candle.
1. Characteristics of the Bullish Engulfing Pattern:
- First Candle (Bearish Candle):
- The first candle in the pattern is a bearish candle, meaning it closes lower than it opens.
- It can be any type of bearish candle (e.g., red or black candle, or candlestick with a long body).
- The closing price of this candle is below the opening price.
- Second Candle (Bullish Candle):
- The second candle is a bullish candle, meaning it closes higher than it opens.
- The key feature of this candle is that its body completely engulfs the body of the previous bearish candle.
- The opening price of the bullish candle is lower than the closing price of the bearish candle, and its closing price is above the opening price of the bearish candle.
- Size Relationship:
- The bullish candle must be larger than the bearish candle, and its body should completely overlap or engulf the entire body of the bearish candle (from open to close).
- Trend Preceding the Pattern:
- The pattern typically appears at the end of a downtrend or during a consolidation phase after the market has been moving lower.
2. Interpretation:
The Bullish Engulfing pattern suggests that the sellers (bears) have lost control and the buyers (bulls) are gaining strength, potentially signaling a reversal in the market. The larger bullish candle following the smaller bearish candle indicates strong buying pressure, overpowering the previous selling activity.
- The pattern signals potential reversal: It is seen as an early indicator of an upward price movement.
- Psychological shift: Traders interpret this pattern as the shift from bearish sentiment (sellers) to bullish sentiment (buyers).
3. Conditions for a Strong Bullish Engulfing Pattern:
- Strong downtrend: The pattern is more reliable when it occurs after a sustained downtrend. A pattern appearing during sideways or choppy markets might be less significant.
- Volume confirmation: Higher volume on the second candle (the bullish candle) adds confirmation to the pattern, as it indicates strong buying interest.
- Significant price move: The larger the engulfing candle, the more powerful the signal, especially if it engulfs a large portion of the prior downtrend.
4. Bullish Engulfing Pattern Example:
Here is a basic example of how the pattern looks:
- Candle 1 (Bearish): The price opens at $100, closes at $95. It’s a red candle.
- Candle 2 (Bullish): The price opens at $94, closes at $105. It’s a green candle, and its body completely engulfs the red candle from the first one.
Chart representation:
- The body of the first candle is entirely within the body of the second candle.
- The shadows (wicks) of the candles may or may not align perfectly, but the critical part is the body engulfment.
5. How to Trade the Bullish Engulfing Pattern:
- Entry: Once the second candle closes, a trader may look for a buy entry, ideally at or just above the high of the second candle.
- Stop-loss: Place a stop-loss just below the low of the second candle (the bullish one), or slightly below the low of the first candle, depending on risk tolerance.
- Target: Set profit targets based on previous support/resistance levels or use a risk-to-reward ratio to determine an exit point.
6. Limitations of the Bullish Engulfing Pattern:
- False signals: Not all Bullish Engulfing patterns result in a reversal. False signals can occur if the market doesn’t have enough momentum or if the market is in a strong uptrend already.
- Context matters: The effectiveness of the pattern depends heavily on the preceding trend. A Bullish Engulfing pattern occurring in an uptrend (i.e., at the end of a pullback) may not always signal a strong reversal. It could just be a continuation signal.
7. Confirmations:
For higher reliability, traders often wait for additional confirmation after the Bullish Engulfing pattern appears:
- Volume: Higher volume on the second candle can provide confirmation that the buying activity is genuine.
- Indicator confirmation: Some traders use additional technical indicators like RSI (Relative Strength Index), MACD, or moving averages to confirm the reversal signal.
- Follow-up candles: Watch the price action in the next few candles. A follow-up bullish candle or a breakout above a previous resistance level adds confirmation.
8. Variations of the Bullish Engulfing Pattern:
- Piercing Line (alternative): This is a related pattern where the second candle opens below the low of the first candle but closes above the midpoint of the first candle’s body. It’s a less powerful reversal signal than a full Bullish Engulfing, but still indicates potential reversal.
- Engulfing Pattern with Gaps: Sometimes, the second candle will form after a price gap (i.e., opening above the high of the first candle). This gap adds to the strength of the reversal signal.
9. Example in Real Market Conditions:
Let’s say a stock has been in a strong downtrend. You observe a small red candle followed by a large green candle that engulfs the previous red candle. If volume is higher on the second green candle and the price moves up significantly in the following days, the pattern has likely worked as intended.
However, if the stock then reverses and falls back below the low of the engulfing candle, it may indicate a false signal, and the trader should cut losses quickly.
Conclusion:
The Bullish Engulfing candlestick pattern is a useful tool for traders looking to identify potential trend reversals. While it can be a powerful signal, especially after a strong downtrend, it is important to consider the broader market context, volume, and other technical indicators to validate the pattern and improve the probability of a successful trade.