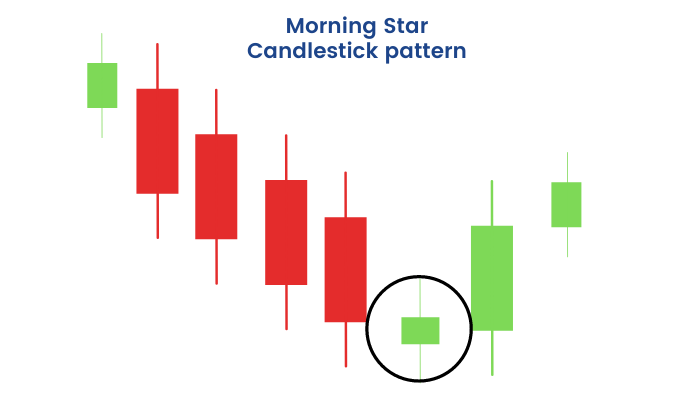
The Morning Star is a bullish reversal candlestick pattern that occurs after a downtrend. It signals a potential reversal in the market from a bearish trend to a bullish trend. The pattern is made up of three candles:
- First Candle (Bearish Candle): A large bearish (red/black) candle that closes at or near its low.
- Second Candle (Doji or Small Candle): A small candle, typically a Doji (where the open and close are very close to each other) or a small-bodied candle, which indicates indecision in the market.
- Third Candle (Bullish Candle): A large bullish (green/white) candle that closes well into the body of the first bearish candle.
The Morning Star is considered a strong reversal pattern, particularly when it forms after a prolonged downtrend, signaling a shift in sentiment from bearish to bullish.
1. Structure of the Morning Star Pattern:
The Morning Star pattern consists of three distinct candles:
- First Candle (Bearish Candle):
- The first candle is a large bearish candle, typically with a long body, indicating strong selling pressure.
- The close of this candle is at or near the low of the candle.
- Second Candle (Indecision Candle):
- The second candle is a small candle with a small body (indicating indecision), such as a Doji or a small bullish/bearish candle.
- The second candle gaps down from the first candle (it opens lower than the first candle’s close) or it might have no gap, depending on market conditions.
- The small body suggests a pause in the trend, as neither bulls nor bears dominate during this session.
- Third Candle (Bullish Candle):
- The third candle is a large bullish candle, typically closing higher than the midpoint of the first candle’s body.
- The strong bullish close shows that buyers have taken control and are pushing the price higher, signaling a possible trend reversal.
2. How to Identify the Morning Star Pattern:
To identify the Morning Star pattern, follow these steps:
- Step 1 – Bearish Candle:
- A large red (bearish) candle that confirms a downtrend. The close should be near the bottom of the candle.
- Step 2 – Indecision Candle:
- A small candle (could be a Doji or a small bullish/bearish candle) that typically opens lower than the previous candle but closes either near the open or near the middle of the first candle. This represents indecision in the market.
- The open and close of this candle are close together, indicating that neither the bulls nor the bears are in control.
- Step 3 – Bullish Candle:
- A large green (bullish) candle that closes at least halfway or more into the body of the first candle, showing strong buying pressure.
- The close of this candle should be higher than the open, signaling a shift in momentum towards the bulls.
3. Ideal Conditions for the Morning Star Pattern:
- Trend Preceding the Pattern: The Morning Star pattern is most effective when it appears after a significant downtrend. It marks the potential start of an uptrend as the bears (sellers) lose control and the bulls (buyers) start gaining strength.
- Gap Down: The second candle (the small one) may open lower than the first candle’s close, indicating a continuation of the bearish trend before a reversal.
- Large Bullish Candle (Third Candle): The third candle should be strong and bullish, ideally closing above the midpoint of the first candle’s body.
- Volume Confirmation: Volume should ideally increase on the third candle (the bullish candle), indicating strong buying interest and confirming the reversal signal.
4. Morning Star and Support Levels:
The Morning Star pattern is more reliable when it appears near key support levels (e.g., historical price levels, moving averages, or Fibonacci retracement levels). The third candle closing above the midpoint of the first candle suggests that the buying pressure has overcome the selling pressure, which often happens near significant support.
5. Example of the Morning Star Pattern:
Consider the following example:
- Candle 1 (Bearish Candle): The price opens at $100, closes at $90.
- Candle 2 (Indecision Candle): The price opens at $88 and closes at $89 (a small Doji or a small bearish candle).
- Candle 3 (Bullish Candle): The price opens at $89 and closes at $110, closing well above the midpoint of the first candle’s body ($95).
In this case, the first candle indicates strong selling, the second candle shows indecision, and the third candle demonstrates strong buying pressure. This could indicate a potential reversal and a shift from a downtrend to an uptrend.
6. How to Trade the Morning Star Pattern:
Entry:
- Traders often enter long positions once the third candle closes, especially if the price closes above the midpoint of the first bearish candle.
- Some traders wait for confirmation with the next few candles, looking for follow-through in the upward direction.
Stop-loss:
- Place a stop-loss just below the low of the second candle (the small body candle). If the price breaks below this level, the pattern may have failed.
- Alternatively, a stop can be placed below the low of the first candle for a wider margin.
Target (Profit Target):
- Set profit targets based on key resistance levels or use a risk-to-reward ratio (e.g., 2:1 or 3:1) to determine where to exit.
- You can also target a recent high or use technical indicators (like moving averages or Fibonacci retracements) to determine possible resistance levels.
7. Confirmations and Additional Tools:
While the Morning Star pattern is a strong reversal signal, it’s important to wait for additional confirmation before entering a trade:
- Volume: Higher volume on the third bullish candle (the large green candle) is a strong confirmation that buyers are entering the market.
- Momentum Indicators: Use tools like the Relative Strength Index (RSI) or MACD to confirm the momentum shift. An RSI crossing above 30 or a bullish crossover in the MACD can add confirmation.
- Support Levels: Ensure that the pattern forms near a significant support level, such as a moving average, trendline, or previous price support.
8. Limitations of the Morning Star Pattern:
- False Signals: As with any candlestick pattern, the Morning Star can sometimes produce false signals, especially in volatile or choppy markets. To mitigate this, it’s important to use confirmation indicators (e.g., volume, RSI) to validate the pattern.
- Requires Context: The pattern is more reliable when it occurs in a strong downtrend. If it appears in an already established uptrend or during sideways price action, the significance of the pattern may diminish.
- Not Always Predictive: Like all technical analysis tools, the Morning Star doesn’t guarantee success. It’s important to consider the broader market context and use risk management practices (e.g., stop losses).
9. Variations of the Morning Star Pattern:
- Shallow Morning Star: Sometimes, the second candle (indecision candle) might not gap down very much and may appear within the body of the first candle. This can still be a valid pattern, though it may not be as powerful as a more pronounced gap.
- Morning Star with Gap: If the second candle opens significantly lower than the first candle, it may create a gap down. This could increase the pattern’s reliability, as it would indicate that bears are still in control before the reversal takes place.
10. Example in a Real Market:
Let’s assume that a stock has been in a downtrend, and you spot the following:
- First Candle (Bearish): A large bearish candle closes at $40, after opening at $45.
- Second Candle (Indecision): A small Doji candle opens at $39 and closes at $40.
- Third Candle (Bullish): A large bullish candle opens at $40 and closes at $47, closing above the midpoint of the first candle.
This could indicate a potential reversal, and the trader might enter a long position once the third candle closes, with a stop-loss placed just below the low of the second candle.
Conclusion:
The Morning Star pattern is a reliable bullish reversal signal when it occurs after a downtrend. It consists of three candles: a large bearish candle, followed by a small indecision candle, and then a large bullish candle. The pattern indicates a potential shift in market sentiment from bearish to bullish, and it works best when confirmed by volume and other technical indicators. However, like all candlestick patterns, it should be used in conjunction with other tools to increase the probability of a successful trade.