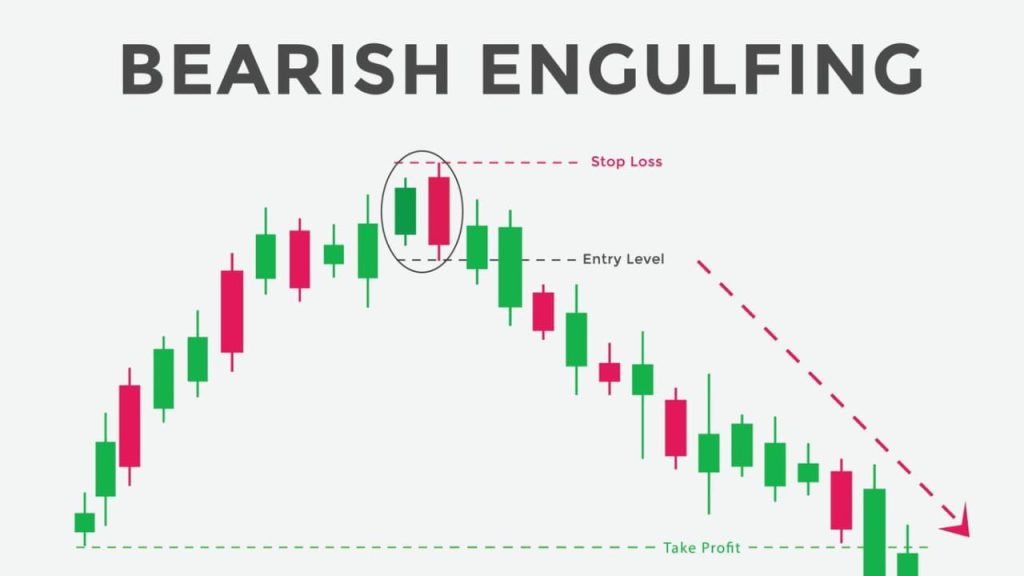
The Bearish Engulfing candlestick pattern is a two-candle reversal pattern that signals a potential change in the trend from bullish to bearish. It typically appears during an uptrend and is seen as a bearish signal.
Components of the Bearish Engulfing Pattern:
- First Candle:
- A small bullish candle (often colored white or green), indicating that buyers are in control.
- It can be a single candle or part of an uptrend.
- Second Candle:
- A larger bearish candle (colored black or red), which engulfs the body of the first candle completely.
- This means the open of the second candle is above the close of the first candle, and the close of the second candle is below the open of the first candle.
Characteristics of a Bearish Engulfing Pattern:
- Trend Preceding the Pattern: The pattern generally forms at the end of an uptrend.
- Size: The second (bearish) candle should be large enough to completely engulf the body of the first (bullish) candle, signaling a shift in momentum.
- Color: The first candle is usually bullish (upward price movement), while the second is bearish (downward price movement).
- Engulfing: The second candle “engulfs” the body of the first candle (i.e., the open and close of the second candle are both outside the open and close of the first candle, but the wicks may overlap).
Example of a Bearish Engulfing:
- Suppose a stock has been rising for a few days (bullish trend).
- On the next day, there’s a large red candle that opens above the previous day’s close but closes significantly below the previous day’s open.
- This creates a Bearish Engulfing pattern, indicating that the bulls’ momentum has been overcome by the bears, and the market could reverse to the downside.
Interpretation:
- Trend Reversal Signal: A Bearish Engulfing suggests that the bullish trend is losing strength and may reverse to a bearish trend.
- Seller Dominance: The large bearish candle signifies strong selling pressure, potentially indicating a shift in market sentiment from buyers to sellers.
- Potential Entry Point: Traders might interpret this pattern as a signal to sell or to short the asset, especially if the pattern is confirmed by additional price action (e.g., continuation of downward movement).
How to Use Bearish Engulfing in Trading:
- Confirmation: It’s crucial to wait for confirmation before acting on the pattern. A follow-through candle (e.g., another bearish candle) on the next day or higher volume can confirm that the reversal is in play.
- Support/Resistance: The pattern is more reliable if it forms near a resistance level, where the price may be expected to struggle and reverse.
- Volume: Higher volume on the bearish candle enhances the pattern’s reliability, as it suggests strong selling pressure.
Example of the Pattern in Context:
- Resistance Level: If a stock has been rising and approaches a resistance zone (a price level where it has struggled before), a Bearish Engulfing pattern at this level might signal that the resistance is holding, and the trend is about to reverse.
- Confirmation of Trend: After the Bearish Engulfing, a continuation of downward movement in subsequent candles can confirm the reversal.
Important Notes:
- False Signals: Like any technical pattern, the Bearish Engulfing is not foolproof. Sometimes, the market may not reverse as expected, so using it in conjunction with other indicators (e.g., RSI, MACD, trendlines) can help increase the reliability of the signal.
- Time Frame: The pattern can appear on any time frame (from minutes to daily charts), but like all patterns, it tends to be more reliable on higher time frames (e.g., daily, weekly).
In summary, the Bearish Engulfing pattern is a strong candlestick reversal pattern that signifies the potential end of a bullish trend and the beginning of a bearish one. Its strength lies in its simplicity, but it is always recommended to confirm the pattern with other technical tools before acting on it.