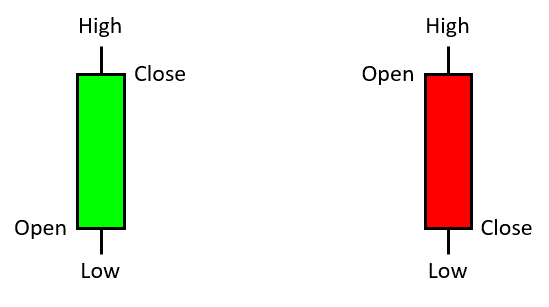
A candlestick pattern is a method of charting and analyzing the price movement of an asset in financial markets, often used in technical analysis. Each candlestick represents price action over a specific time frame (such as 1 minute, 5 minutes, 1 day, etc.) and displays four key data points:
- Open: The price at the start of the time period.
- Close: The price at the end of the time period.
- High: The highest price reached during that time period.
- Low: The lowest price reached during that time period.
Candlesticks are typically displayed with a “body” (the area between the open and close prices) and “wicks” or “shadows” (the lines above and below the body that show the range between the high and low prices).
Common Candlestick Patterns:
Candlestick patterns can indicate market sentiment and potential future price movements. Some common patterns include:
1. Bullish Patterns (Indicating Potential Price Uptrend)
| Pattern Name | Candlestick Type | Indication | Location |
|---|---|---|---|
| Bullish Engulfing | 2 candles: small bearish, large bullish | Reversal from downtrend to uptrend, buyers take control | At the end of a downtrend |
| Morning Star | 3 candles: bearish, small, bullish | Reversal from downtrend to uptrend | At the end of a downtrend |
| Hammer | 1 candle: small body, long lower wick | Reversal after downtrend, bulls starting to take control | At the bottom of a downtrend |
| Inverted Hammer | 1 candle: small body, long upper wick | Reversal after downtrend, potential bullish breakout | At the bottom of a downtrend |
| Piercing Line | 2 candles: bearish, bullish | Reversal from downtrend to uptrend | At the end of a downtrend |
| Three White Soldiers | 3 candles: consecutive long bullish | Strong bullish momentum, continuation or new uptrend | After a downtrend or consolidation |
| Bullish Marubozu | 1 candle: no shadows, open low, close high | Strong bullish sentiment, continuation of uptrend | In an uptrend or after a pullback |
| Tweezer Bottom | 2 candles: same low | Reversal from downtrend to uptrend | At a key support level |
| Rising Three Methods | 5 candles: 1 long bullish, 3 small bearish, 1 long bullish | Continuation of uptrend after consolidation | After a consolidation or pullback |
2. Bearish Patterns (Indicating Potential Price Downtrend)
| Pattern Name | Candlestick Type | Indication | Location |
|---|---|---|---|
| Bearish Engulfing | 2 candles: small bullish, large bearish | Reversal from uptrend to downtrend, sellers take control | At the end of an uptrend |
| Evening Star | 3 candles: bullish, small, bearish | Reversal from uptrend to downtrend | At the end of an uptrend |
| Shooting Star | 1 candle: small body, long upper wick | Reversal after uptrend, signs of weakness in bulls | At the top of an uptrend |
| Hanging Man | 1 candle: small body, long lower wick | Reversal after uptrend, signs of bearish pressure | At the top of an uptrend |
| Dark Cloud Cover | 2 candles: bullish, bearish | Reversal from uptrend to downtrend | At the end of an uptrend |
| Three Black Crows | 3 candles: consecutive long bearish | Strong bearish momentum, continuation or new downtrend | After an uptrend or consolidation |
| Marubozu (Bearish) | 1 candle: no shadows, open high, close low | Strong bearish sentiment, likely continuation of downtrend | In a downtrend or after a rally |
| Tweezer Top | 2 candles: same high | Reversal from uptrend to downtrend | At a key resistance level |
| Rising Three Methods (Bearish) | 5 candles: 1 long bearish, 3 small bullish, 1 long bearish | Continuation of downtrend after consolidation | After a consolidation or rally |
3. Neutral Patterns (Indicating Uncertainty or Continuation)
| Pattern Name | Candlestick Type | Indication | Location |
|---|---|---|---|
| Doji | 1 candle: small body, long shadows | Indicates indecision, possible reversal or continuation | Anywhere in a trend or consolidation |
| Spinning Top | 1 candle: small body, long upper and lower shadows | Indecision, market uncertainty, possible reversal or continuation | At the end of a trend or consolidation |
| Long-legged Doji | 1 candle: very small body, long upper and lower shadows | Extreme indecision, potential for reversal | At the top or bottom of a trend |
| Dragonfly Doji | 1 candle: small body near the top, long lower shadow | Possible bullish reversal, especially after a downtrend | At the bottom of a downtrend |
| Gravestone Doji | 1 candle: small body near the bottom, long upper shadow | Possible bearish reversal, especially after an uptrend | At the top of an uptrend |
| Morning Doji Star | 3 candles: bearish, doji, bullish | Reversal from downtrend to uptrend, buyers gaining control | At the end of a downtrend |
| Evening Doji Star | 3 candles: bullish, doji, bearish | Reversal from uptrend to downtrend, sellers taking control | At the end of an uptrend |
| Belt Hold | 1 candle: strong bullish or bearish with no shadow on the opposite side | Indicates strong sentiment in the direction of the candle | After a trend or consolidation |
| Inside Bar | 2 candles: small body inside the range of the previous candle | Indicates consolidation or indecision, possible breakout | In the middle of a trend or consolidation |
| Harami | 2 candles: large body, small body inside the previous candle’s range | Indecision, potential reversal or continuation | At the end of a trend |
How Candlestick Patterns Are Used:
Traders use candlestick patterns in combination with other indicators (like moving averages, RSI, or support/resistance levels) to make informed trading decisions. However, candlestick patterns alone aren’t always reliable, so they are usually part of a broader technical analysis strategy.