The Doji is a very popular and significant candlestick pattern in technical analysis, representing a point of indecision in the market. It occurs when the open and close prices are very close or exactly the same, resulting in a candlestick with a very small body. The pattern can occur in any market, timeframe, and trend and is often used to signal a potential reversal, consolidation, or continuation depending on its context and surrounding price action.
Key Features of a Doji:
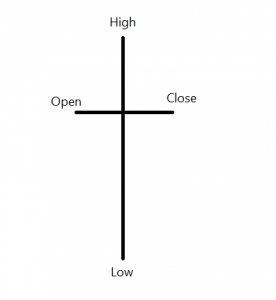
- Small Body:
- A Doji has a very small body, often so small that it looks like a cross or plus sign (though this is not always the case). The open and close prices are very close, indicating indecision between buyers and sellers.
- The Doji’s body might be so small that it is almost invisible, and the price movement is shown mainly by the upper and lower shadows (wicks).
- Upper and Lower Shadows:
- A Doji typically has long upper and lower shadows (or wicks), indicating that both buyers and sellers tried to take control during the period, but neither side succeeded in moving the price significantly in one direction.
- The size of the shadows can vary, but they reflect the range of price movement within that candle.
- Indecision:
- The small body and long shadows indicate that the market is in a state of indecision, with neither the bulls nor the bears gaining dominance during the trading session. This can suggest that a trend is losing momentum or is at a turning point.
Types of Doji Candlestick Patterns:
There are several variations of the Doji pattern, based on the position and length of the shadows, which provide additional context about market sentiment:
- Standard Doji:
- The open and close are virtually the same, with long upper and lower shadows.
- This represents complete indecision, with neither the bulls nor the bears able to push the price far enough to establish a clear winner.
- Long-Legged Doji:
- This variation has long upper and lower shadows with a small body in the middle. It indicates high indecision and significant price movement during the session, but it ends near the open/close level.
- This can be a strong sign of reversal when it appears after a long trend, showing that the price could be at a turning point.
- Gravestone Doji:
- A Gravestone Doji occurs when the open and close are near the low of the session, and there is a long upper shadow.
- It is generally considered a bearish reversal signal, especially if it appears after an uptrend, as it shows that bulls tried to push prices higher but ultimately failed, and the bears took control.
- Dragonfly Doji:
- A Dragonfly Doji occurs when the open and close are near the high of the session, with a long lower shadow.
- It is typically considered a bullish reversal signal, especially when it appears after a downtrend, as it indicates that the bears pushed the price lower but the bulls took control by the close.
Interpretation of the Doji:
The Doji candlestick pattern, due to its small body, signifies indecision in the market. It suggests that neither buyers nor sellers are in control, and the price may be at a turning point. However, the interpretation of a Doji depends heavily on its context, including:
- Trend Preceding the Doji:
- After an uptrend: A Doji could signal that the bulls are losing momentum, and a reversal or consolidation may be coming.
- After a downtrend: A Doji could indicate that the bears are losing control, and the market may be preparing for a reversal to the upside.
- Volume:
- Higher volume on a Doji can give more weight to the pattern. A Doji with high volume suggests that the indecision is significant, with more participants unsure about the direction of the market.
- Low volume Doji patterns often indicate uncertainty but may not carry as much weight in signaling a reversal or continuation.
- Confirmation:
- A Doji by itself is often not enough to make a trading decision. Traders generally look for confirmation from subsequent candles to verify whether the market is truly reversing or just consolidating.
- Confirmation could come in the form of a strong follow-through candle, such as a large bullish or bearish candle after the Doji, indicating which direction the market is likely to go.
Trading Strategies with the Doji:
- As a Reversal Signal:
- Doji after an uptrend: If a Doji forms after a strong uptrend, it may indicate that the buying pressure is losing strength, and a reversal to the downside may be coming.
- Doji after a downtrend: If a Doji forms after a downtrend, it may indicate that the selling pressure is losing momentum, and a reversal to the upside may occur. In both cases, traders often wait for a confirmation candle to verify the reversal, such as a strong bearish candle after a Doji at the top of an uptrend (for a bearish reversal) or a strong bullish candle after a Doji at the bottom of a downtrend (for a bullish reversal).
- As Part of a Larger Pattern:
- A Doji can form part of other candlestick patterns such as:
- Engulfing Patterns: A Doji might form as the second candle in a bearish or bullish engulfing pattern, indicating indecision before the reversal.
- Morning Star / Evening Star: A Doji may form as the middle candle in these reversal patterns.
- Star Patterns: A Doji could act as the “star” candle in the Morning Star (bullish) or Evening Star (bearish) patterns, which are reliable reversal signals when confirmed by the next candle.
- In Sideways Markets:
- In a range-bound market where prices are moving within defined support and resistance levels, the Doji can indicate a point of indecision where the market is preparing for a breakout, either up or down.
- If the price breaks above resistance after a Doji, it could signal a bullish move. If it breaks below support, it could signal a bearish move.
Example of a Doji in Trading:
- Uptrend: The price has been rising strongly, and then a Doji forms at the top of the trend.
- Indecision: The Doji indicates that the buying pressure is waning and that neither the bulls nor the bears are gaining control.
- Confirmation: To confirm a reversal, traders would look for a bearish candle in the next period. If the next candle closes lower than the low of the Doji, it may signal a potential downturn. Conversely, if the next candle is bullish and moves higher, the Doji may have just signaled a consolidation rather than a reversal, and the uptrend could continue.
Key Notes and Risks:
- False Signals: The Doji can sometimes produce false signals, especially when it appears during a period of low volatility or in a consolidating market. A Doji without confirmation could simply indicate market indecision rather than a strong trend reversal.
- Not Always a Reversal: A Doji does not always indicate a reversal. In some cases, it simply marks a point of indecision in the market, where a continuation of the current trend might follow. Context and subsequent candles are critical for determining its meaning.
- Context Matters: The location of the Doji relative to previous price action is crucial. For instance, a Doji at the top of an uptrend or at the bottom of a downtrend can signal a potential reversal, while one in the middle of a trend might indicate continuation.
Summary:
A Doji is a candlestick pattern characterized by a very small body and long upper and lower shadows, signaling indecision in the market. It can appear in any trend, but its significance depends on its context. In an uptrend, a Doji can signal a potential reversal to the downside, while in a downtrend, it may signal a potential reversal to the upside. For confirmation, traders typically wait for the next candle to provide direction. The Doji can also form part of more complex candlestick patterns and is often more reliable when it appears with higher volume and clear price action following it.