The Dragonfly Doji is a type of Doji candlestick pattern that signals a potential reversal in the market, typically at the bottom of a downtrend. It is characterized by a small body located at or near the high of the candlestick, with a long lower shadow. This pattern suggests that during the trading session, sellers were initially in control, pushing the price lower, but ultimately the buyers managed to push the price back up to close near the opening price, signaling a possible shift in momentum.
The Dragonfly Doji is often seen as a bullish reversal pattern, especially when it occurs after a downtrend, though it requires confirmation from subsequent price action to confirm the reversal.
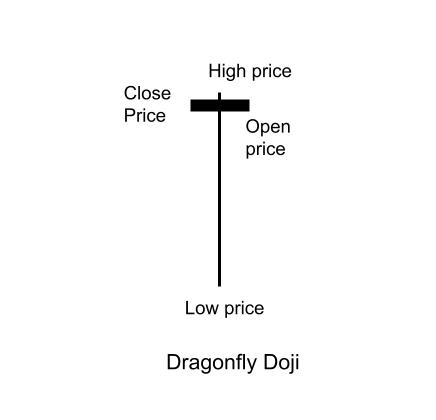
Key Features of the Dragonfly Doji:
- Small Body at the Top:
- The body of the Dragonfly Doji is small and located at or near the top of the candlestick, meaning that the open and close prices are very close to each other. This reflects indecision in the market, as neither the buyers nor the sellers could maintain control throughout the session.
- The small body suggests that the market opened and closed at nearly the same price, which signifies indecision.
- Long Lower Shadow:
- The long lower shadow is the defining feature of the Dragonfly Doji. It shows that the price initially dropped significantly, as sellers pushed the price lower, but the buyers came back strongly and drove the price back up.
- The lower shadow is usually at least twice the length of the body, though in some cases, it may be even longer.
- The long lower shadow indicates rejection of lower prices, signaling that the downward pressure from the sellers has been absorbed, and the market is starting to turn.
- Indecision and Reversal Signal:
- The Dragonfly Doji represents indecision in the market: although the sellers dominated for a period, the buyers managed to regain control by the end of the session. This suggests that the market could be on the verge of a bullish reversal.
- When it appears after a downtrend, the Dragonfly Doji is typically seen as a sign that selling pressure is weakening, and the price may start to rise.
How to Interpret the Dragonfly Doji:
- Bullish Reversal After a Downtrend:
- The Dragonfly Doji is most significant when it forms after a downtrend. It suggests that the sellers tried to push the price lower, but the bulls were able to regain control and push the price back up to close near the opening price.
- This rejection of lower prices could signal a bullish reversal, where the market might start to trend higher after the pattern forms. However, it is important to look for confirmation of the reversal from subsequent candlesticks or other technical indicators.
- Context Matters:
- The location of the Dragonfly Doji within the existing trend is crucial for interpreting its meaning:
- After a downtrend: If the Dragonfly Doji appears at the bottom of a downtrend, it is more likely to indicate a potential reversal to the upside.
- At key support levels: If the Dragonfly Doji forms near support levels, it strengthens the case for a bullish reversal. A strong reaction from buyers near support increases the likelihood of a price move to the upside.
- In a consolidation or range-bound market: The Dragonfly Doji could signal that the market is pausing before continuing in the same direction or breaking out.
- Confirmation:
- The Dragonfly Doji is not a standalone signal. To confirm the potential for a reversal, traders typically wait for the next candlestick or additional technical indicators to validate the signal.
- A bullish confirmation candle (a green or white candle that closes higher than the Dragonfly Doji’s close) after the Doji suggests that buyers are taking control, and the price may continue higher.
- If no confirmation candle appears, or if a bearish candle follows the Doji, the pattern could fail, and the market might continue to trend lower.
- Volume:
- Volume can provide additional insight into the strength of the reversal signal. A Dragonfly Doji formed with increased volume may indicate stronger conviction from buyers, making the reversal signal more reliable.
- If the Dragonfly Doji forms on low volume, it might be a less significant signal, and the market could be more likely to continue in the previous trend.
Trading Strategies with the Dragonfly Doji:
- Reversal Signal in a Downtrend:
- After a downtrend: The Dragonfly Doji suggests that the bearish momentum is weakening. Traders might look to enter a long position (buy) if the next candlestick confirms the reversal (e.g., a strong bullish candle).
- The stop-loss can be placed just below the low of the Dragonfly Doji’s lower shadow to manage risk.
- Breakout or Support Rejection:
- If the Dragonfly Doji forms at a support level and the price rises after the pattern, it may indicate a support rejection and a breakout to the upside.
- Traders can place stop-loss orders just below the low of the pattern to protect against a failed breakout or false signal.
- Wait for Confirmation:
- Since the Dragonfly Doji indicates indecision, it is important to wait for confirmation from the next candle. A bullish confirmation candle (a candlestick that closes higher than the Dragonfly Doji’s close) provides more confidence in the potential reversal.
- Candlestick patterns such as bullish engulfing or morning star can further confirm the reversal signal.
- Risk Management:
- Stop-Loss: Place a stop-loss just below the low of the Dragonfly Doji’s lower shadow to limit risk if the reversal does not occur.
- Profit Targets: Traders can target key resistance levels, recent highs, or other technical levels for profit-taking. A risk-to-reward ratio of at least 2:1 is typically preferred.
Example of Dragonfly Doji in Context:
- After a Downtrend:
- The price has been falling for several days, and a Dragonfly Doji forms at the bottom of the trend. The lower shadow indicates that the sellers tried to push the price lower, but buyers regained control by the end of the session.
- A trader might wait for a bullish confirmation candle (a green candle) the following day to enter a long position, anticipating that the price could move higher.
- At Key Support:
- A Dragonfly Doji forms near a key support level after a downtrend, signaling that buyers are coming in and rejecting lower prices. A bullish breakout above resistance levels after the Doji could signal a potential move to the upside.
- Confirmation of Reversal:
- After the Dragonfly Doji forms, the next candle is a strong bullish candlestick that closes higher than the previous close. This confirms the reversal, and the trader might enter a long position, targeting higher resistance levels.
Differences Between the Dragonfly Doji and Other Doji Patterns:
- Dragonfly Doji vs. Standard Doji:
- The Standard Doji has small bodies with short shadows, indicating indecision in the market but no significant price movement. The Dragonfly Doji has a long lower shadow and suggests that the market tested lower prices but ultimately rejected them, showing more strength in the reversal potential.
- The Dragonfly Doji is often viewed as a bullish reversal after a downtrend, while the Standard Doji is more neutral and could indicate indecision without a clear direction.
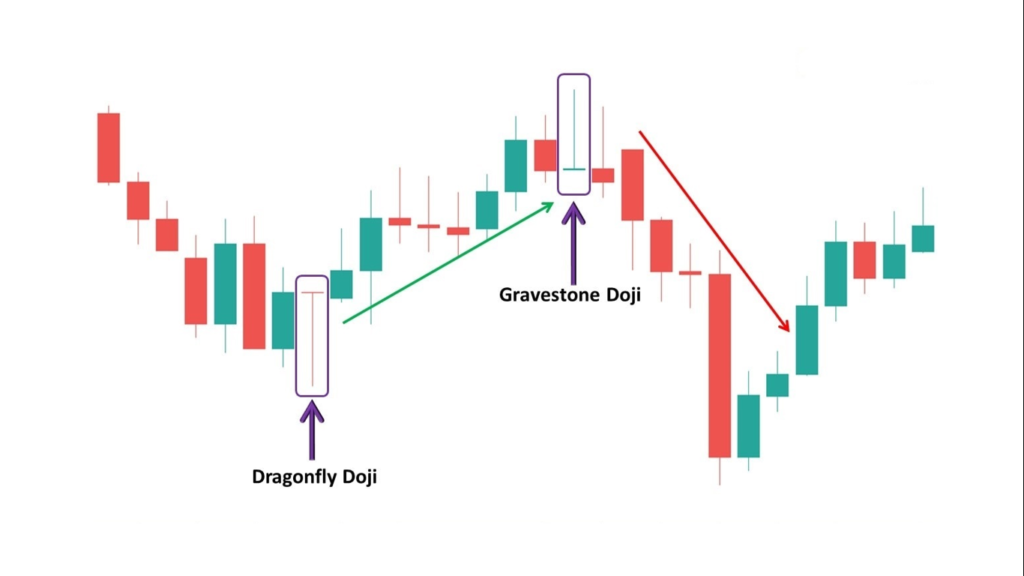
- Dragonfly Doji vs. Gravestone Doji:
- The Gravestone Doji has a long upper shadow and a small body near the low of the candlestick, indicating that buyers tried to push the price higher but ultimately failed. This pattern typically appears at the top of an uptrend and signals a potential bearish reversal.
- The Dragonfly Doji, in contrast, has a long lower shadow and small body at the top, indicating that sellers initially gained control but were overcome by buyers, suggesting a bullish reversal after a downtrend.
- Dragonfly Doji vs. Hammer:
- A Hammer has a long lower shadow, but its small body is near the top of the candlestick, similar to the Dragonfly Doji. However, the Hammer usually appears after a downtrend and indicates that the trend could reverse to the upside, whereas the Dragonfly Doji specifically signifies that buyers overcame sellers during the session, especially after a strong downtrend.
Important Notes:
- False Signals: Like any candlestick pattern, the Dragonfly Doji can sometimes produce false signals, especially if the market is in a period of low volatility or consolidation. It’s important to wait for confirmation from the next candlestick or additional technical indicators.
- Trend Confirmation: If the Dragonfly Doji forms after a strong downtrend, the likelihood of a successful reversal is higher, but confirmation is still necessary to ensure the pattern is not just a momentary pause in the trend.
Summary:
The Dragonfly Doji is a candlestick pattern that signifies market indecision and potential for
a bullish reversal, especially when it forms after a downtrend. It is characterized by a small body near the top of the candlestick and a long lower shadow, indicating that although sellers initially controlled the market, buyers were able to push prices back up by the close. For confirmation of a reversal, traders typically look for a bullish follow-up candle or other technical signals. The Dragonfly Doji is a useful tool for identifying possible trend reversals or rejections of lower prices near support.