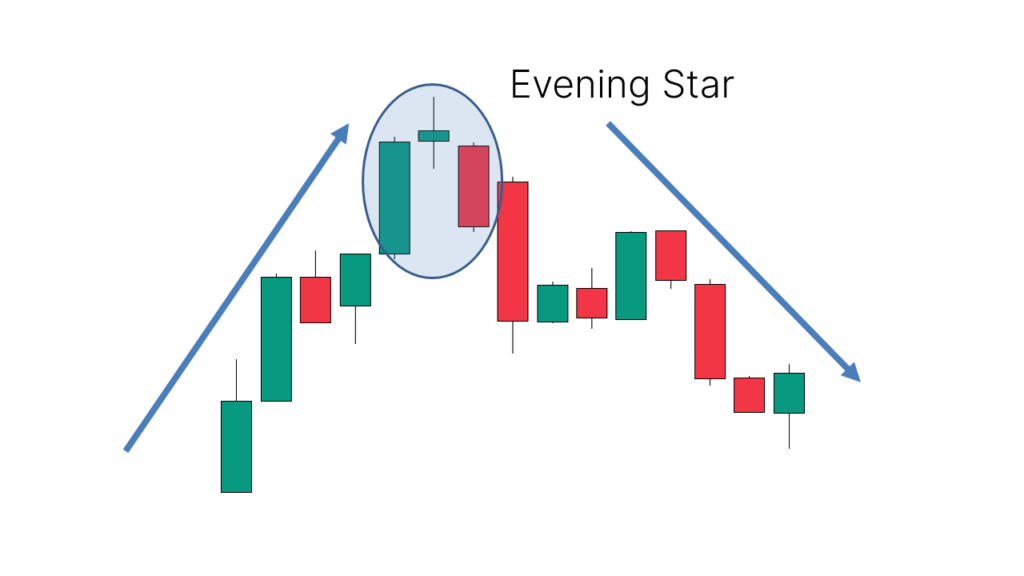
The Evening Star is a bearish candlestick reversal pattern that typically signals the end of an uptrend and the start of a downtrend. It is a three-candle formation that appears at the top of an uptrend, suggesting that bullish momentum is losing strength and the market may be about to reverse.
Components of the Evening Star Pattern:
- First Candle:
- A long bullish (white or green) candle that closes near its high, indicating strong buying pressure and continuation of the uptrend.
- Second Candle:
- A small-bodied candle (can be bullish or bearish), often referred to as the “star” (hence the name “Evening Star”). This candle represents indecision in the market, as neither buyers nor sellers gain clear control.
- It gaps away from the first candle, either up or down, signaling that momentum is weakening.
- It can be a Doji (where the open and close are nearly the same), an inverted Doji, or another small-bodied candle.
- Third Candle:
- A long bearish (black or red) candle that closes well below the midpoint of the first candle, indicating that sellers have taken control of the market.
- The close of this third candle should ideally be below the body of the first candle, confirming the reversal.
Characteristics of the Evening Star Pattern:
- Trend: The Evening Star forms at the peak of an uptrend, typically after a strong bullish run.
- Gaps: The second candle (the “star”) may gap up or down relative to the first, signaling a potential shift in momentum.
- Indecision: The second candle’s small body reflects market indecision, and the third candle is where sellers overpower the buyers, confirming the reversal.
- Bearish Confirmation: The third candle should close below the midpoint of the first candle to confirm the reversal.
Example of an Evening Star Pattern:
Imagine a stock has been steadily rising for several days (or weeks). The price then forms a long bullish candle (the first candle), followed by a smaller candle (the second), which may gap higher or show a Doji. The next day, a long bearish candle forms (the third candle), closing significantly below the close of the first candle. This formation indicates that the bulls have lost control, and a bearish reversal is likely.
Interpretation:
- The Evening Star pattern is a reversal signal, indicating that the upward trend is weakening, and a potential downtrend or price pullback could follow.
- Sellers are in control: The long bearish candle of the third bar suggests that sellers have taken over from the buyers.
- Market indecision: The small-bodied second candle indicates a pause or indecision in the market, as neither buyers nor sellers dominate, but it sets the stage for the bearish reversal.
How to Use the Evening Star in Trading:
- Trend: Look for the Evening Star after a strong uptrend. It is more reliable when it appears after a pronounced bullish movement.
- Confirmation: The pattern is more effective if confirmed by subsequent price action. A further downtrend after the pattern forms strengthens the bearish signal.
- Volume: A higher volume on the third bearish candle adds strength to the signal. A low volume on the third candle could reduce the pattern’s reliability.
- Support/Resistance: If the Evening Star forms near a resistance level, the pattern is considered more significant, as it suggests the price may be struggling to break through and could reverse downward.
- Stop-Loss: Traders might place a stop-loss order above the high of the second candle (the “star”) to limit potential losses if the trend doesn’t reverse.
Example of the Pattern in Action:
- Uptrend: A stock has been rising steadily for a few weeks. On the last day of the uptrend, you see a strong bullish candle (first candle).
- Indecision: The next day, a smaller candle (second candle) forms. It could gap up or be a Doji, suggesting the market is unsure.
- Bearish Reversal: The third day brings a strong bearish candle (third candle) that closes well below the first candle, signaling that the bulls are losing control and the price may fall.
Important Notes:
- False Signals: Like any technical pattern, the Evening Star is not infallible and can sometimes fail to produce a reversal. It’s essential to confirm the pattern with other indicators, such as volume, trendlines, RSI, or moving averages.
- Time Frame: The pattern can appear on any time frame, but it is generally more reliable on higher time frames (daily, weekly) where the trend is more established.
Differences Between Evening Star and Morning Star:
- The Morning Star is the opposite of the Evening Star. It’s a bullish reversal pattern that occurs at the end of a downtrend.
- The Evening Star suggests a shift from an uptrend to a downtrend, while the Morning Star signals a reversal from a downtrend to an uptrend.
In summary, the Evening Star candlestick pattern is a reliable bearish reversal signal when it appears at the top of an uptrend. It consists of three candles: a long bullish candle, followed by a small-bodied “star” candle, and a long bearish candle that confirms the reversal. As with all technical patterns, it’s crucial to use the Evening Star in conjunction with other indicators to confirm its validity and avoid false signals.