The Harami is a candlestick pattern that consists of two candles and can signal either a reversal or a pause in the market, depending on its context within the trend. The word “Harami” comes from the Japanese term for “pregnant” because the second candle (the smaller one) is “contained” within the body of the first candle (the larger one), like a pregnancy.
Key Features of the Harami Pattern:
- Two Candles:
- The Harami pattern is made up of two candles: the first candle is a large candlestick (either bullish or bearish), and the second candle is a smaller candle that is completely contained within the range of the first candle’s body (i.e., its open and close).
- The second candle can be either bullish or bearish, and it must have a body smaller than the first candle, with its open and close being within the high and low of the first candle.
- Harami (Bullish or Bearish):
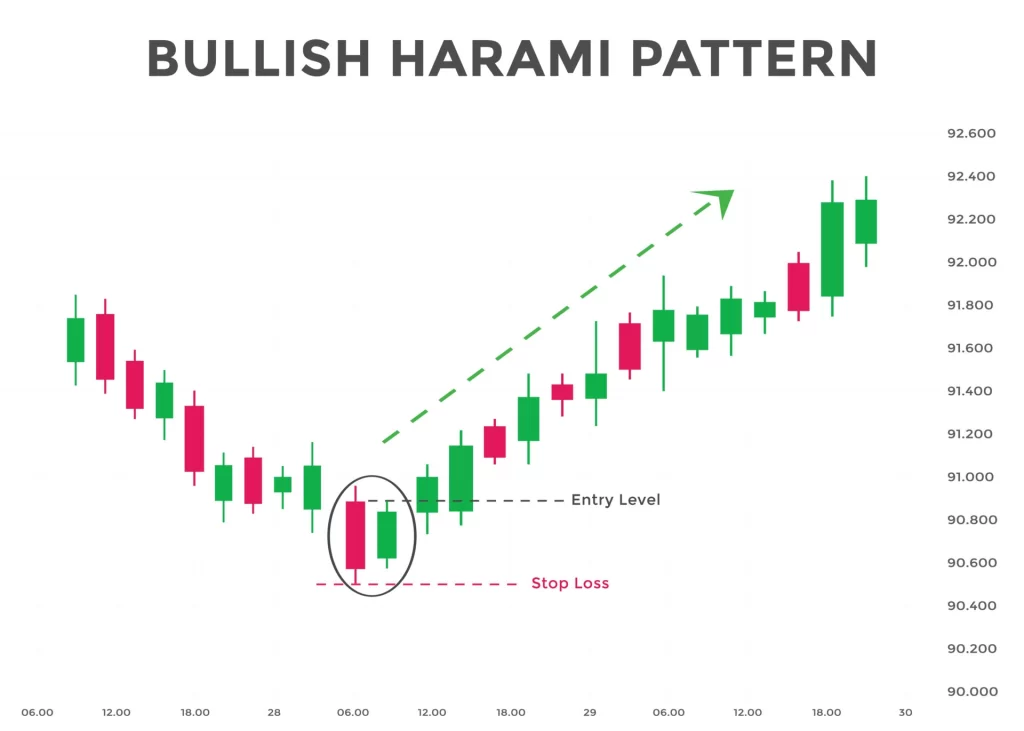
- Bullish Harami: A bearish candle followed by a smaller bullish candle. The second, smaller bullish candle suggests that the bearish momentum is weakening, and the trend might reverse to the upside.
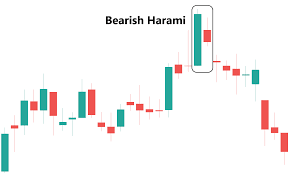
- Bearish Harami: A bullish candle followed by a smaller bearish candle. The second, smaller bearish candle suggests that the bullish momentum is weakening, and the trend may reverse to the downside.
How to Interpret the Harami:
- Bullish Harami:
- A bullish Harami appears after a downtrend and signals a potential bullish reversal. The first candle is a large bearish candle, indicating strong selling pressure. The second candle is a smaller bullish candle that closes within the range of the first candle’s body. This suggests that the bears’ control is weakening, and the bulls may be preparing to take over, potentially causing a reversal to the upside.
- Confirmation: A bullish Harami pattern is more reliable when followed by a strong bullish candle that breaks above the high of the second candle. A close above the high of the second candle confirms the reversal signal.
- Bearish Harami:
- A bearish Harami appears after an uptrend and signals a potential bearish reversal. The first candle is a large bullish candle, indicating strong buying pressure. The second candle is a smaller bearish candle that closes within the range of the first candle’s body. This suggests that the buying momentum is weakening, and the sellers might soon take control, potentially leading to a downtrend.
- Confirmation: A bearish Harami is more reliable when followed by a strong bearish candle that closes below the low of the second candle. A close below the low of the second candle confirms the reversal signal.
- Indecision and Pause:
- In some cases, the Harami can represent a pause or indecision rather than a full reversal. This is especially true if the pattern appears during a period of consolidation or when the trend is already losing momentum.
- In this case, the second candle indicates that the market is taking a break, and traders may be awaiting further price action to determine the next direction.
Context of the Harami Pattern:
- Trend Context:
- The Harami is generally viewed as a reversal pattern when it appears after a strong trend, either up or down.
- After a downtrend, the bullish Harami suggests that selling pressure is weakening, and the market could shift direction to the upside.
- After an uptrend, the bearish Harami suggests that buying pressure is weakening, and the market could shift direction to the downside.
- Support and Resistance:
- The Harami pattern is more reliable when it forms near support levels (in the case of a bullish Harami) or near resistance levels (in the case of a bearish Harami). If the Harami forms in these areas, it is more likely to signal a reversal.
- Volume:
- Volume can help confirm the validity of the Harami pattern:
- For a bullish Harami, higher volume during the second, smaller candle (the bullish candle) would suggest stronger buying interest.
- For a bearish Harami, higher volume during the second, smaller candle (the bearish candle) would suggest stronger selling interest.
Trading Strategy with the Harami:
- Entry:
- Bullish Harami: Enter a long position (buy) after the second candle (the smaller bullish candle) closes, especially if the next candle confirms the breakout by closing above the high of the second candle.
- Bearish Harami: Enter a short position (sell) after the second candle (the smaller bearish candle) closes, especially if the next candle confirms the breakout by closing below the low of the second candle.
- Stop-Loss:
- For a bullish Harami, place a stop-loss below the low of the second candle (or the low of the mother bar, depending on your strategy).
- For a bearish Harami, place a stop-loss above the high of the second candle (or the high of the mother bar).
- Target:
- Profit targets for the bullish Harami can be set based on recent resistance levels or using technical indicators like Fibonacci retracement or moving averages.
- Profit targets for the bearish Harami can be set based on recent support levels or using similar technical tools.
- Confirmation:
- Confirmation is crucial for both the bullish and bearish Harami patterns. Traders often wait for the price to break above or below the range of the second candle (the small bullish or bearish candle), ensuring the reversal is valid.
Example of a Bullish Harami:
- After a prolonged downtrend, a large bearish candle forms, followed by a smaller bullish candle whose open and close are entirely within the body of the first candle. The price begins to move higher, confirming that the bulls are gaining control. Traders may enter a long position with a stop-loss below the low of the second candle.
Example of a Bearish Harami:
- After a prolonged uptrend, a large bullish candle forms, followed by a smaller bearish candle whose open and close are entirely within the body of the first candle. The price begins to move lower, confirming that the bears are taking control. Traders may enter a short position with a stop-loss above the high of the second candle.
Example of the Harami as Indecision:
- If a Harami pattern forms within a range (not at the end of a strong trend), it may signal indecision in the market, suggesting that the price could remain range-bound or that a breakout is coming soon. In this case, traders would wait for confirmation (either a breakout above or below the pattern) before entering a trade.
Summary:
The Harami is a two-candle pattern that can indicate a trend reversal or pause. A bullish Harami appears after a downtrend, suggesting potential upside, while a bearish Harami appears after an uptrend, suggesting potential downside. The second, smaller candle is completely contained within the range of the first candle, showing that market momentum is weakening. Confirmation from subsequent candles and volume can increase the reliability of the pattern.