The Inverted Hammer is a single candlestick pattern that can signal a potential bullish reversal, particularly when it occurs after a downtrend. It is similar in structure to the Hammer candlestick, but the key difference is that the long shadow (wick) is above the body instead of below it. This pattern suggests that despite initial selling pressure during the trading session, buyers were able to push the price significantly higher by the close, indicating that buying interest may be increasing.
1. Characteristics of the Inverted Hammer:
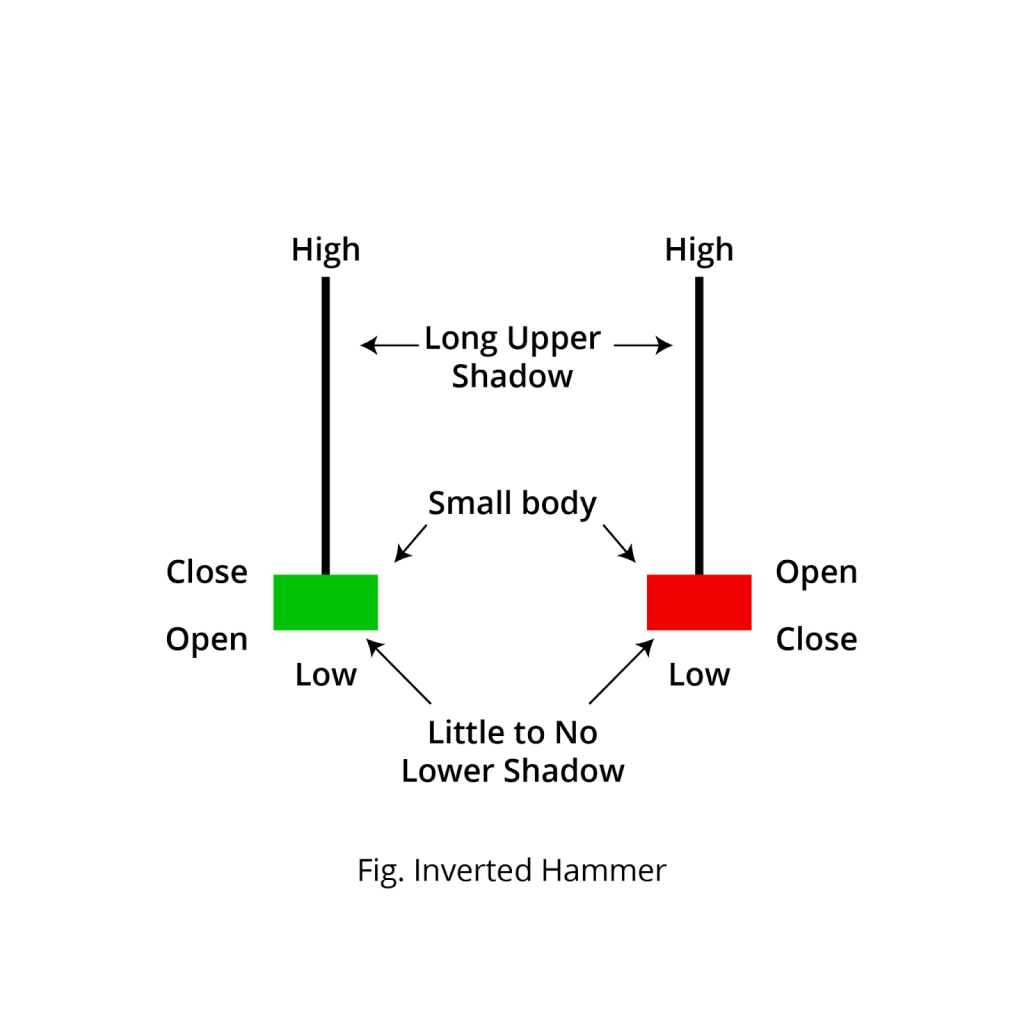
The Inverted Hammer has the following key features:
- Small Body: The body of the Inverted Hammer is small and typically located near the bottom of the candlestick, either at the open or close of the session. It can be either bullish (green/white) or bearish (red/black), but the color is not as important as the pattern’s shape.
- Long Upper Shadow: The hallmark of the Inverted Hammer is its long upper shadow. The upper wick should be at least twice the length of the body. This long upper wick indicates that during the session, buyers tried to push the price higher, but the bears eventually regained control and drove the price back down.
- Little or No Lower Shadow: The lower shadow is very short or nonexistent. This shows that the price did not fall much during the session, and the market closed near or at the opening price.
Inverted Hammer Criteria:
- Small real body: The body is small, and the open and close prices are near each other, either at the top or bottom of the candle.
- Long upper shadow: The upper shadow is long, usually at least twice the length of the body, showing that the bulls tried to drive prices higher but were met with resistance.
- Little to no lower shadow: There is either no lower wick or a very small one, indicating that the price did not dip much during the session.
- Location: The Inverted Hammer appears after a downtrend, suggesting a potential reversal in price direction.
2. How to Identify the Inverted Hammer Pattern:
To spot an Inverted Hammer on a chart, follow these steps:
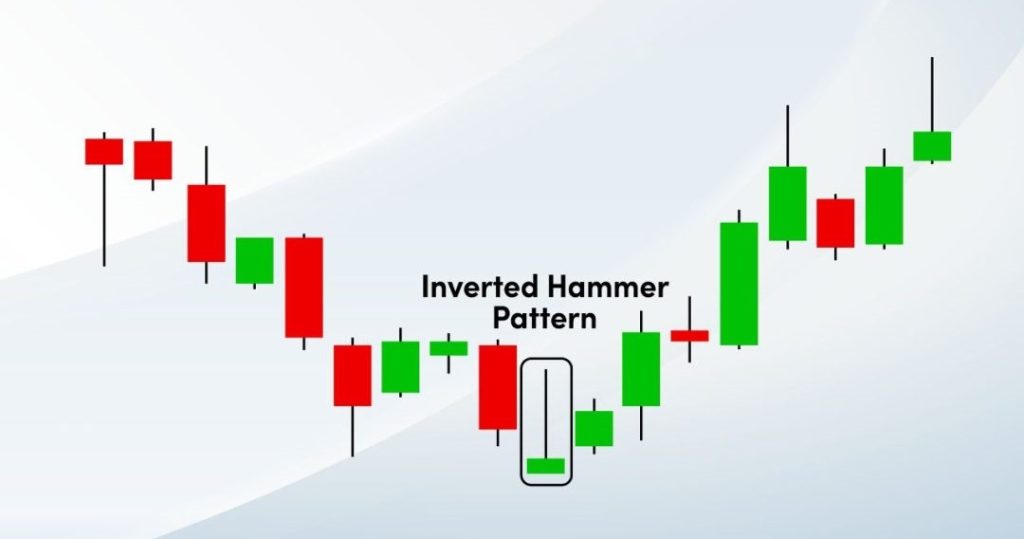
- Trend Preceding the Pattern: The Inverted Hammer should appear after a downtrend. It signals that the sellers (bears) have been in control, but the long upper shadow suggests that the bulls (buyers) are starting to gain strength and may be pushing for a reversal.
- Candle Body: The body of the candlestick is small and located near the bottom of the range, either at the open or close. The small body indicates indecision, meaning neither bulls nor bears dominated the session, but the long upper shadow indicates that the buyers tried to push the price higher.
- Upper Shadow: The key feature of the Inverted Hammer is the long upper shadow, at least twice the length of the body. This shows that the bulls managed to push the price upward during the session, but the bears fought back and drove the price back down, leaving the price near the open or low of the session.
- Lower Shadow: The lower shadow is either nonexistent or very small, indicating that the price did not drop significantly during the session.
3. Interpretation of the Inverted Hammer:
The Inverted Hammer suggests a potential trend reversal from a downtrend to an uptrend. Here’s why:
- Sellers Try to Push the Price Lower: The long upper shadow indicates that sellers initially took control during the session and drove the price down.
- Buyers Take Control by the Close: However, as the session progressed, the bulls were able to push the price back up, resulting in a small body at the top of the range (close to the open). This indicates that buying pressure is increasing, and the trend could be reversing.
- Indecision and Reversal: The small body suggests indecision, but the long upper shadow suggests that the bulls are starting to overpower the bears, signaling a possible shift in market sentiment.
However, the Inverted Hammer by itself is not always a reliable signal. Confirmation is essential to validate the reversal, which typically comes in the form of a strong bullish candle following the Inverted Hammer.
4. How to Trade the Inverted Hammer Pattern:
Entry:
- Traders may enter a buy position after the formation of the Inverted Hammer if the next candle is a bullish one that closes above the high of the Inverted Hammer. This would confirm that the bulls have taken control and the market is reversing.
- The entry point would typically be just above the high of the Inverted Hammer candle to capture the upside momentum.
Stop-Loss:
- Place a stop-loss just below the low of the Inverted Hammer. If the price drops below this level, it suggests that the reversal is not happening, and the downtrend could continue.
- Alternatively, you could place a stop-loss slightly below the Inverted Hammer’s body or the low of the previous candlestick, depending on your risk tolerance.
Profit Target:
- Profit targets can be set based on nearby resistance levels, such as previous swing highs or trendline resistance. You can also use risk-to-reward ratios (e.g., 2:1 or 3:1) to determine your exit point.
- Traders may also use technical indicators (such as moving averages, Fibonacci retracements, or Bollinger Bands) to identify key levels of resistance where the price might encounter selling pressure.
5. Confirmation for the Inverted Hammer Pattern:
While the Inverted Hammer is a potential bullish reversal pattern, confirmation is crucial to increase the probability of a successful trade. Here’s how to confirm the reversal:
- Confirmation Candle: A strong bullish candle (green/white) that closes above the high of the Inverted Hammer provides confirmation that the market is indeed reversing. This shows that the buyers have taken control, and the price is likely to move higher.
- Volume: Higher volume on the confirmation candle increases the reliability of the reversal. Increased volume indicates that the buying interest is genuine, and the trend reversal has more strength.
- Technical Indicators: Additional confirmation can be obtained from momentum indicators such as:
- RSI (Relative Strength Index): If the RSI is in oversold territory (below 30) and begins to rise, this can confirm that the market is transitioning from a bearish to a bullish phase.
- MACD (Moving Average Convergence Divergence): A bullish crossover in the MACD, where the MACD line crosses above the signal line, can confirm the potential reversal.
- Moving Averages: If the price moves above a key moving average (e.g., the 50-day or 200-day), this could provide additional confirmation that the trend is reversing.
6. Limitations of the Inverted Hammer Pattern:
- False Signals: The Inverted Hammer can sometimes lead to false signals, especially in volatile or sideways markets. If the price does not confirm the reversal with a bullish follow-up candle, the pattern may be invalid.
- Requires Confirmation: The Inverted Hammer alone is not a guaranteed signal of a reversal. Traders should always wait for confirmation before entering a trade. Without confirmation, the price may continue to move lower, and the reversal may fail.
- Context Matters: The Inverted Hammer is most reliable when it forms after a strong downtrend. In a choppy or sideways market, it may not be as effective.
7. Inverted Hammer vs. Hanging Man:
The Inverted Hammer and the Hanging Man candlestick patterns are structurally identical, both having a small body near the bottom of the candlestick and a long upper shadow. The key difference is in the trend leading up to the pattern:
- Inverted Hammer: Appears after a downtrend, signaling a potential reversal to the upside (bullish reversal).
- Hanging Man: Appears after an uptrend, signaling a potential reversal to the downside (bearish reversal).
Both patterns indicate a shift in market sentiment, but the context of the trend before the pattern is crucial in determining whether the pattern signals a bullish or bearish reversal.
8. Example of the Inverted Hammer Pattern:
Let’s say the price of a stock has been declining for several weeks, and you observe the following:
- Candle 1 (Downtrend): A long bearish (red/black) candle, indicating strong selling pressure.
- Candle 2 (Inverted Hammer): A small-bodied candle with a long upper shadow. The price opens at $50, moves up to $55, but closes at $51, near the opening price.
After this Inverted Hammer, if a strong bullish candlestick forms the next day, closing above the high of the Inverted Hammer, you could consider entering a long position at or above the high of the Inverted Hammer. A stop-loss would be placed just below the low of the Inverted Hammer, and a profit target could be set at the next resistance level.
9. Key Takeaways:
- The Inverted Hammer is a bullish reversal pattern that appears after a downtrend, signaling that buyers may be taking control.
- It consists of a small body near the bottom of the candlestick with a long upper shadow and little to no lower shadow.
- Confirmation is crucial for the Inverted Hammer to be reliable, typically in the form of a bullish follow-up candle closing above the high of the Inverted Hammer.
- Volume, momentum indicators, and other technical tools can provide additional confirmation to