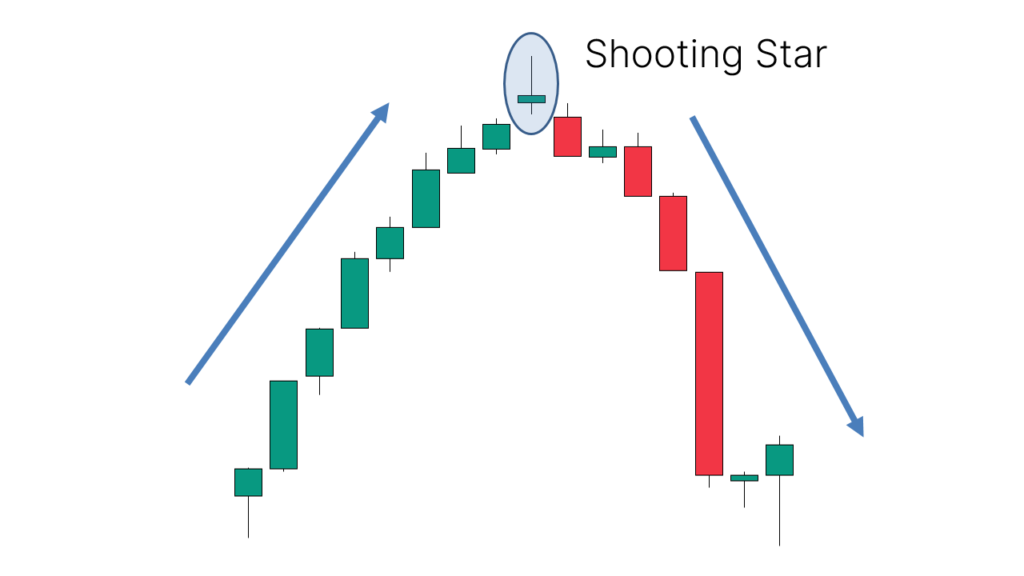
The Shooting Star is a bearish candlestick pattern that typically appears after an uptrend, signaling a potential reversal or a top in the market. It is a single candlestick pattern with a distinctive shape, often viewed as a warning that bullish momentum may be fading and that a reversal to the downside could be imminent.
Key Features of the Shooting Star Pattern:
- Upper Shadow:
- The candlestick has a long upper shadow that is at least twice the length of the body (the open and close).
- This long upper shadow indicates that the price moved significantly higher during the trading session but was unable to maintain those gains and closed near or at the open.
- Small Body:
- The body of the candle is small, and it is typically located at the lower end of the candlestick. The body can be either bullish (green or white) or bearish (red or black), but the small body is important to signify that there was no strong closing push in either direction.
- The small body indicates indecision in the market, as both buyers and sellers had some influence during the session, but neither side could dominate.
- Lower Shadow:
- The lower shadow is short or non-existent, meaning that there was little to no downward movement during the session.
Ideal Context for the Shooting Star:
- Uptrend: The Shooting Star is a reversal pattern that typically forms at the top of an uptrend. It suggests that after a period of buying pressure, the market is starting to lose momentum and that sellers may be gaining control.
- Price Action: The long upper shadow suggests that the price moved much higher during the day but could not maintain those gains. The close near the open (especially near the low) shows that the bears are beginning to overpower the bulls.
Example of the Shooting Star Pattern:
- Imagine a stock has been rising for several days, and then on a given day, the price opens higher, rallies to a significant high during the session, but then closes near the open. This forms a candlestick with a small body and a long upper shadow, signaling a potential reversal.
- If the next day’s price action confirms the pattern with a bearish move (e.g., a gap down or strong bearish candle), the Shooting Star pattern has been validated, and the uptrend may be reversing.
Interpretation:
- Bearish Reversal: The Shooting Star is considered a bearish reversal pattern, especially when it occurs after a strong uptrend. It suggests that while buyers were initially in control, sellers gained strength as the session progressed, and the market failed to sustain the higher prices.
- Indecision: The small body indicates indecision in the market, as the buyers pushed prices up but could not hold the gains, leaving the market vulnerable to a potential downturn.
- Sellers Taking Control: The long upper shadow signals that while bulls tried to push the price higher, they failed, and the sellers gained the upper hand, which might lead to a price drop.
How to Use the Shooting Star in Trading:
- Confirmation:
- The pattern itself is not always sufficient for a trade decision. It’s essential to wait for confirmation that the trend is reversing. This could come in the form of a bearish candle on the next day (such as a large red candle) or a break of a key support level.
- For example, if the price opens lower or shows sustained bearish momentum after the Shooting Star, it strengthens the case for a reversal.
- Stop-Loss Placement:
- A common strategy is to place a stop-loss just above the high of the Shooting Star (the top of the long upper shadow). This way, if the market continues to rise and breaks the high of the Shooting Star, the trade can be exited.
- Volume:
- Higher volume on the Shooting Star can enhance the pattern’s reliability. A Shooting Star with high volume suggests stronger conviction in the shift from bullish to bearish sentiment.
- Support and Resistance:
- The Shooting Star is more reliable when it forms near a resistance level. Resistance levels are price areas where the price has struggled to break through previously. If the Shooting Star forms near such a level, it is seen as a stronger signal that the uptrend may be coming to an end.
Example of the Shooting Star in Context:
- Uptrend: A stock has been rallying strongly for several weeks.
- Shooting Star Forms: On one of the days, the stock opens at $100, rallies to $110 during the session, but then closes near $99 (or close to the open).
- Bearish Signal: The Shooting Star is formed, indicating that although the bulls tried to push prices higher, they failed to maintain those gains, and the market may be about to reverse.
- Confirmation: If the next day, the stock opens lower and continues down, this could confirm that the uptrend is reversing, and traders might take this as a signal to sell or short the stock.
Differences Between Shooting Star and Inverted Hammer:
- The Shooting Star appears during an uptrend and signals a potential bearish reversal.
- The Inverted Hammer appears during a downtrend and signals a potential bullish reversal.
- The Shooting Star has a bearish implication, while the Inverted Hammer has a bullish implication, despite having similar shapes.
Important Notes:
- False Signals: Like all candlestick patterns, the Shooting Star is not foolproof. A false signal can occur if the next candle does not confirm the reversal, and the price continues higher.
- Time Frame: The Shooting Star can appear on any time frame (from minutes to daily charts), but it tends to be more reliable on longer time frames (daily or weekly charts).
- Volume: A Shooting Star with higher volume is generally considered more significant. It shows that the buying pressure was strong enough to push the price higher, but sellers came in forcefully to push it back down, signaling a potential reversal.
Summary:
The Shooting Star is a bearish reversal candlestick pattern that occurs after an uptrend. It features a small body near the bottom of the candle with a long upper shadow and little or no lower shadow. The pattern signals that buyers tried to push prices higher but failed, and sellers may be taking control. To increase the reliability of the signal, traders typically look for confirmation in subsequent candles, such as a strong bearish candle or a break below key support levels. The Shooting Star is more effective when it appears near resistance, and its effectiveness is enhanced with higher volume.